Summary
Lots of functions have nice smooth graphs, so if you want to find out what's going on near a point a in the domain, you just ask what the function value is at that point (f(a)). In the neighborhood of the point of interest, function values get really pretty close to f(a), especially as you get really close to a.
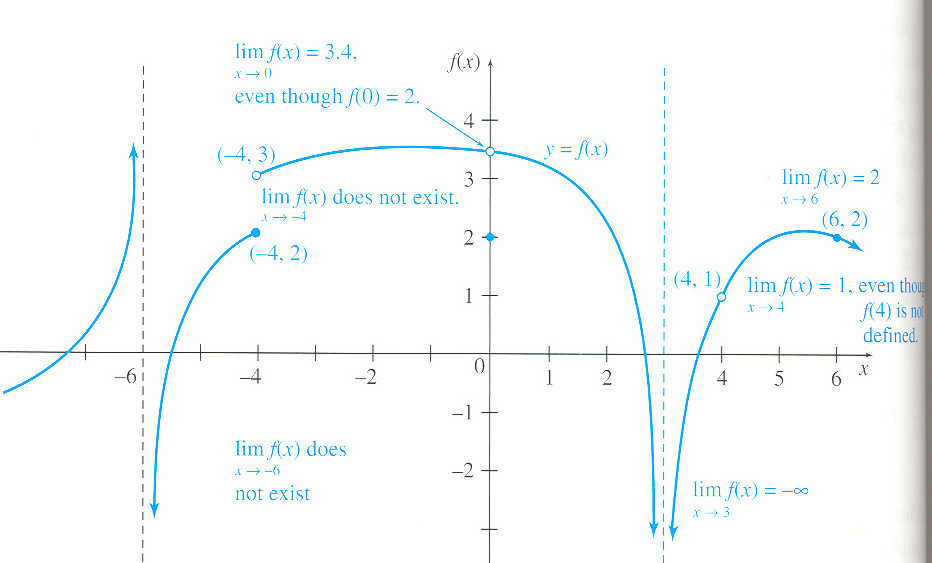
But in a couple of cases, strange things happen at a point, and you can't trust points in the neighborhood of the point of interest. For example, some rational functions have vertical asymptotes, and some step functions have jumps (like taxi prices). This figure (Figure 6, p. 144) from our text makes clear that functions can have pretty nasty graphs:
For functions like this, there are places you can approach along the x-axis where not everyone in the neighborhood is on the same page. For example, at the points x=-6 (where there's a vertical asymptote), and x=-4 (where a jump exists).
x=0 and x=4 are not problems: though there are holes in the graph at those points (so that the function is not even defined there), the neighbors agree with each other as they get close to those points.
When everyone in the neighborhood IS on the same page, then as you approach a you can trust the neighbors to give you pretty good agreement, and as you get closer to a the agreement gets better and better and better!
Definition: Let f be a function and let a and L be real numbers. If
![]()
Note: it's not essential that f be defined at a - only that the function be defined in the neighborhood of a.
In fact, limits may be defined from left or right only, in case functions are well behaved on only one side of a function.
Definition: the limit from the left is equal to L as x approaches a if points in the neighborhood of x to the left of a are getting closer and closer to L as x gets closer and closer to a. It is denoted
![]()
Similarly the limit from the right is similarly defined, denoted
![]()
The limit of f is equal to L at a if and only if both one-sided limits exist and are equal.
In the function shown in the graph above,
![]()
while
![]()
so the limit of f as ![]() does not exist, as the limits do not agree.
does not exist, as the limits do not agree.
Rules for limits: Let a, A, and B be real numbers, and let f and g be functions such that
![]()
![]()
and
![]()
![]()
![]()
![]()
Now many functions have smooth graphs: for these functions, we can always write that
![]()
Polynomials have smooth graphs; rational functions have smooth graphs; power functions have smooth graphs; exponential functions have smooth graphs; and logarithmic functions have smooth graphs. All of these functions are smooth on their domains, so they satisfy the relation above.
Sometimes we're interested in limits at infinity, rather than at a particular point a. This is related to the idea of horizontal asymptotes:
Definition f has a limit of L at ![]() if
if
![]()
f has a limit of L at ![]() if
if
![]()
So a horizontal asymptote is an example of this type of limit. A particular examples:
![]()
for n>0.
More generally, limits of rational functions of the form
![]() at infinity can be determined by
throwing out all by the highest terms of p(x) and q(x), and looking at the
limit of the resulting rational function.
at infinity can be determined by
throwing out all by the highest terms of p(x) and q(x), and looking at the
limit of the resulting rational function.