Day 10 in math modeling
- Homework:
- Read 3.1-3.4
- Problems/Exercises from chapter 2 due Wednesday.
- Discuss homework/project problems
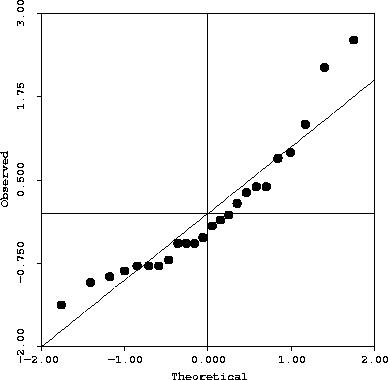
- quantile plots - another (visual) test for normality (or for fit
to any given distribution)
- We'll end in the lab (time permitting), using project file Day9.nb. We want to work on Project 2.3 (and, by
analogy, your second class project):
- Simulate the deterministic population of Chickadees for
100 years.
- Simulate the stochastic population of Chickadees for 100
years, assuming normal survival and recruitment parameters.
- Can you create a qqplot of the survival and recruitment
parameters?
Website maintained by Andy Long.
Comments appreciated.