- Read 3.5-3.7
- Exercises pp. 136-137, #2, 3
- Review of matrix operations and issues
- State Diagrams for Stage/Class models
- State diagram for female human population
- Translation into equations
- Translation into matrix equations
- Iteration for Figure 3.1, p. 103, and Figure 3.2
- State diagram for bank account
- State diagram for bank account with investment
- Exercise 1a, p. 135
- Translation into equations
- Translation into matrix equations
- Iteration for initial vector (100,100,100). Is the ratio of adolescents to adults moving toward what you'd expect?
- State diagram for female human population
- Haven't we already encountered these models?
My objective in giving you the Mathematica file we looked at last week in lab is to give you the tools you need to tackle the project in Mathematica. Last time in lab I asked you to work on a Mathematica file I'd prepared. Unfortunately, due to the usual sorts of problems, little got done in general.
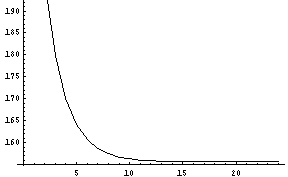
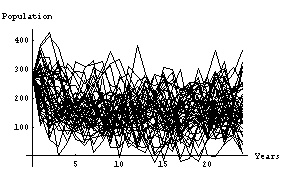
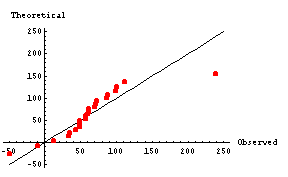
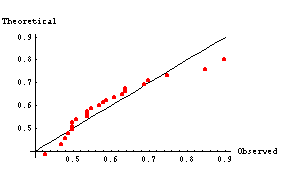
Starting from that file, you can finish it off in Mathematica using commands that you can find in previous notebooks (e.g. Chapter1.nb shows how to create basic recurrence relations (p. 379); Chapter2.nb has a snippet of code in which multiple simulations are plotted (p. 390); and I used the Sort command in the file Day9.nb, which you can use to rank the data and create a scatter plot of the ranked data versus the quantiles, to create the q-q plot.
As always, I'm glad to work with anyone one-on-one to carry out this project. Feel free to contact me to sit down with Mathematica and go through the kinds of examples you'll need to get this project done.
If you're using other software, and are having trouble duplicating the kinds of features we've used in Mathematica, let me know and maybe we can work something out.
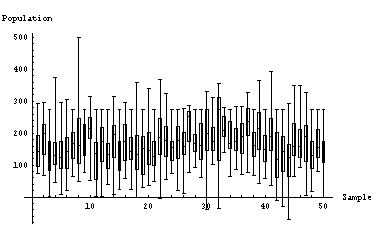
Adding a few lines of code to the Mathematica file we looked at in lab last time, I generated the following results:
