- Hand in exercises and Project 3.2 from Chapter 3
- Exercise #7, p. 226
- Examples (continued):
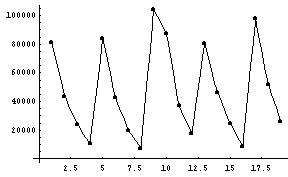
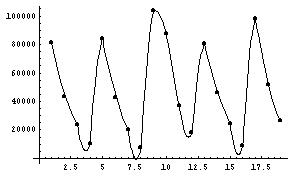
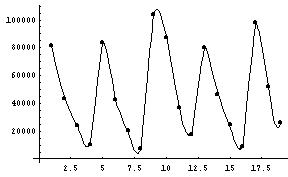
- Lynx data:
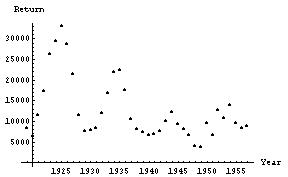
- Long term trend: horizontal asymptote (perhaps zero!)
- Decaying oscillations (some periodicity)
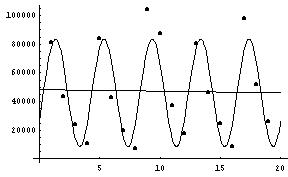
- Book's modeling process:
- Capture decreasing trend with linear model (linear regression: y=mt+b)
- "Detrend" the data, creating new variable zi = yi - (mti+b)
- Guess period of oscillations of z
- Determine amplitude "envelope" of the damping (using linear regression on ln(abs(z)) for the peak data, to estimate exponential model f(t)=exp(Mt+B))
- Put it all together: estimate the model
y(t)=a + b*t + c*f(t)sin(2 pi t / 10) + d*f(t)sin(2 pi t / 10)
Notes:
- this model is linear in the parameters a, b, c, and d.
- ultimate behavior of model: leads to negative numbers of lynx
- Corn Storage example (more later: section
4.13). Correlation: -0.02
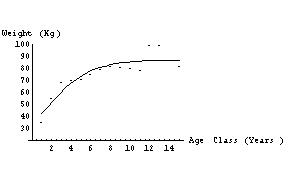
- Bear data - intrinsically non-linearizable model: the logistic
-
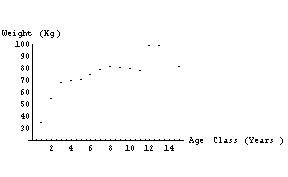
- long term trend: horizontal asymptote
- concave down? Increasing with decreasing slope....
- positive y-intercept
- model: logistic
y(t)=K/(1 + Cexp(-rt))
ory(t)=K/(1 + exp(-r(t-t0)))
- "With nonlinear problems such as the logistic, choosing good [initial parameter] guesses is essential." (p. 183)
-
- Jack's Project: a nonlinear regression problem
- Lynx data:
- Interpolation
- Interpolating n+1 points with an nth
degree polynomial - a bad idea? ("saturated model")
- An easy example(?) from
Mensa and my cereal box:
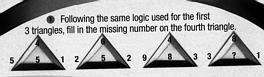
4 6 4 8 5 2 9 3 1 2 3 1 5 5 8 ? The text reads: "Following the same logic used for the first 3 triangles, fill in the missing number on the fourth triangle." (my emphasis)
This illustrates the pervasiveness of "linear reasoning". Mathematicians can find infinitely many functions that will "fit" this data - exactly! (An exact fit to data is the very definition of interpolation.) "Mensa" has fixated on the linear solution, which is typical but unfortunate, especially for a society of "geniuses". How can we follow "the same logic" when an infinite number of logics give different answers?
Now - for the $25,000 question, and a chance to get into Mensa - what is the Mensa answer?
- Spline: a function built piecewise out of curve segments,
with some smoothness condition
- linear spline - use straight line segments (continuity)
- quadratic spline - use parabolas (differentiable)
- cubic spline - use cubics (twice differentiable)
- linear spline - use straight line segments (continuity)
- Exercise #7, p. 226: How-to, why-to.
- Interpolating noisy data
- "[T]he human eye can be as good at curve fitting as any algorithm." p. 195.
- That said, here's the human eye algorithm:
- plot data carefully
- draw (by hand) the perceived trend
- pick reference points
- interpolate reference points
- Interpolating n+1 points with an nth
degree polynomial - a bad idea? ("saturated model")
Note: