- Homework notebooks due next Wednesday (all work from Chapter 2, up to - but not including - Project 2).
- Project 2 (due the 21st).
- chi-square example: decile cutpoints for a standard (N(0,1))
normal distribution:
- 0,0.253347,0.524401,0.841621,1.28155
- survival: mean=0.591667; std. dev=0.118089
-


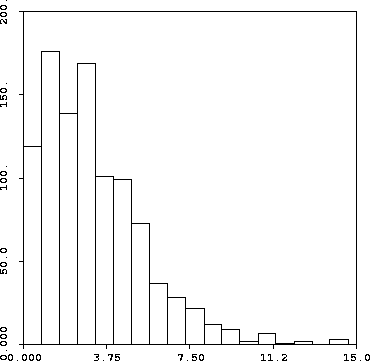
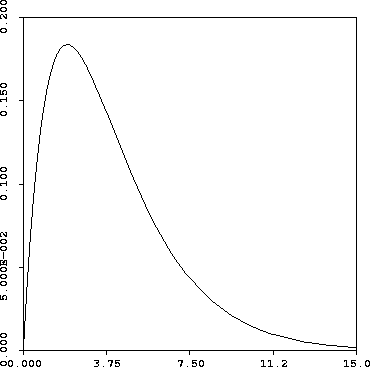
At left is the result of running 1000 simulations of the chi-square statistic using a random sample from a normal distribution; at right is the chi-square with degree 4. Pretty similar, yes?
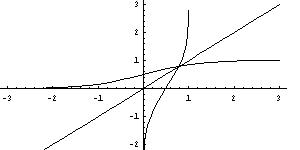
- quantile function (inverse of cdf):

- quantile plots - another (visual) test for normality (or for fit to any given distribution)
- Simulate the deterministic population of Chickadees for 100 years.
- Simulate the stochastic population of Chickadees for 100 years, assuming normal survival and recruitment parameters.
- Can you create a qqplot of the survival and recruitment parameters?