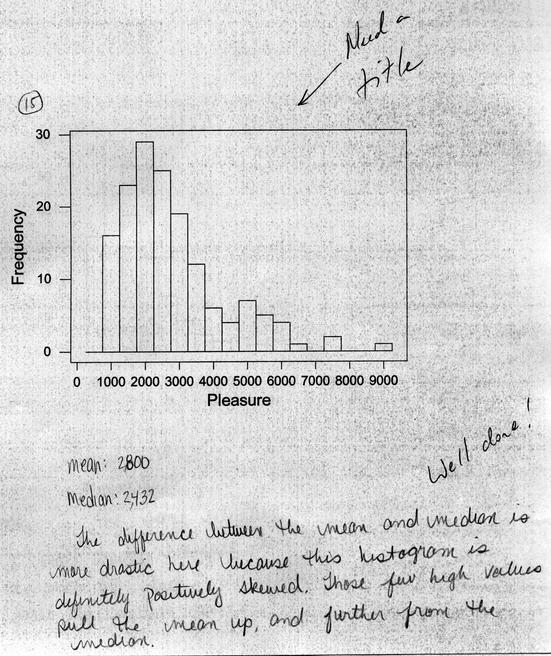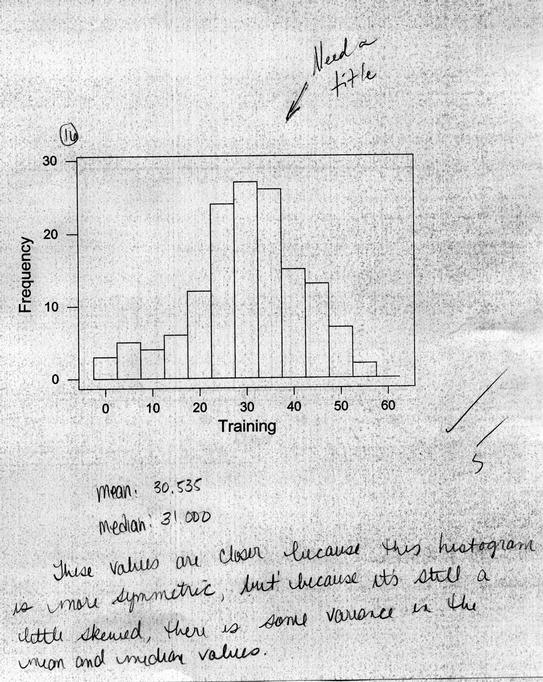
For this problem there were actually two histograms to construct and analyze. They were essentially the same, however.

I'd say that this distribution is symmetric. You'll never get one that's perfectly symmetric from real data. The mean and median are really quite close, especially considering the standard deviation in this case....