- This is how the exam felt, to you and to me.
- Exam 3
- key
- Curve: c(x)=100 + 2(x-40)
- Stats (after curve):
- Mean: 76.3
- SD: 14.6
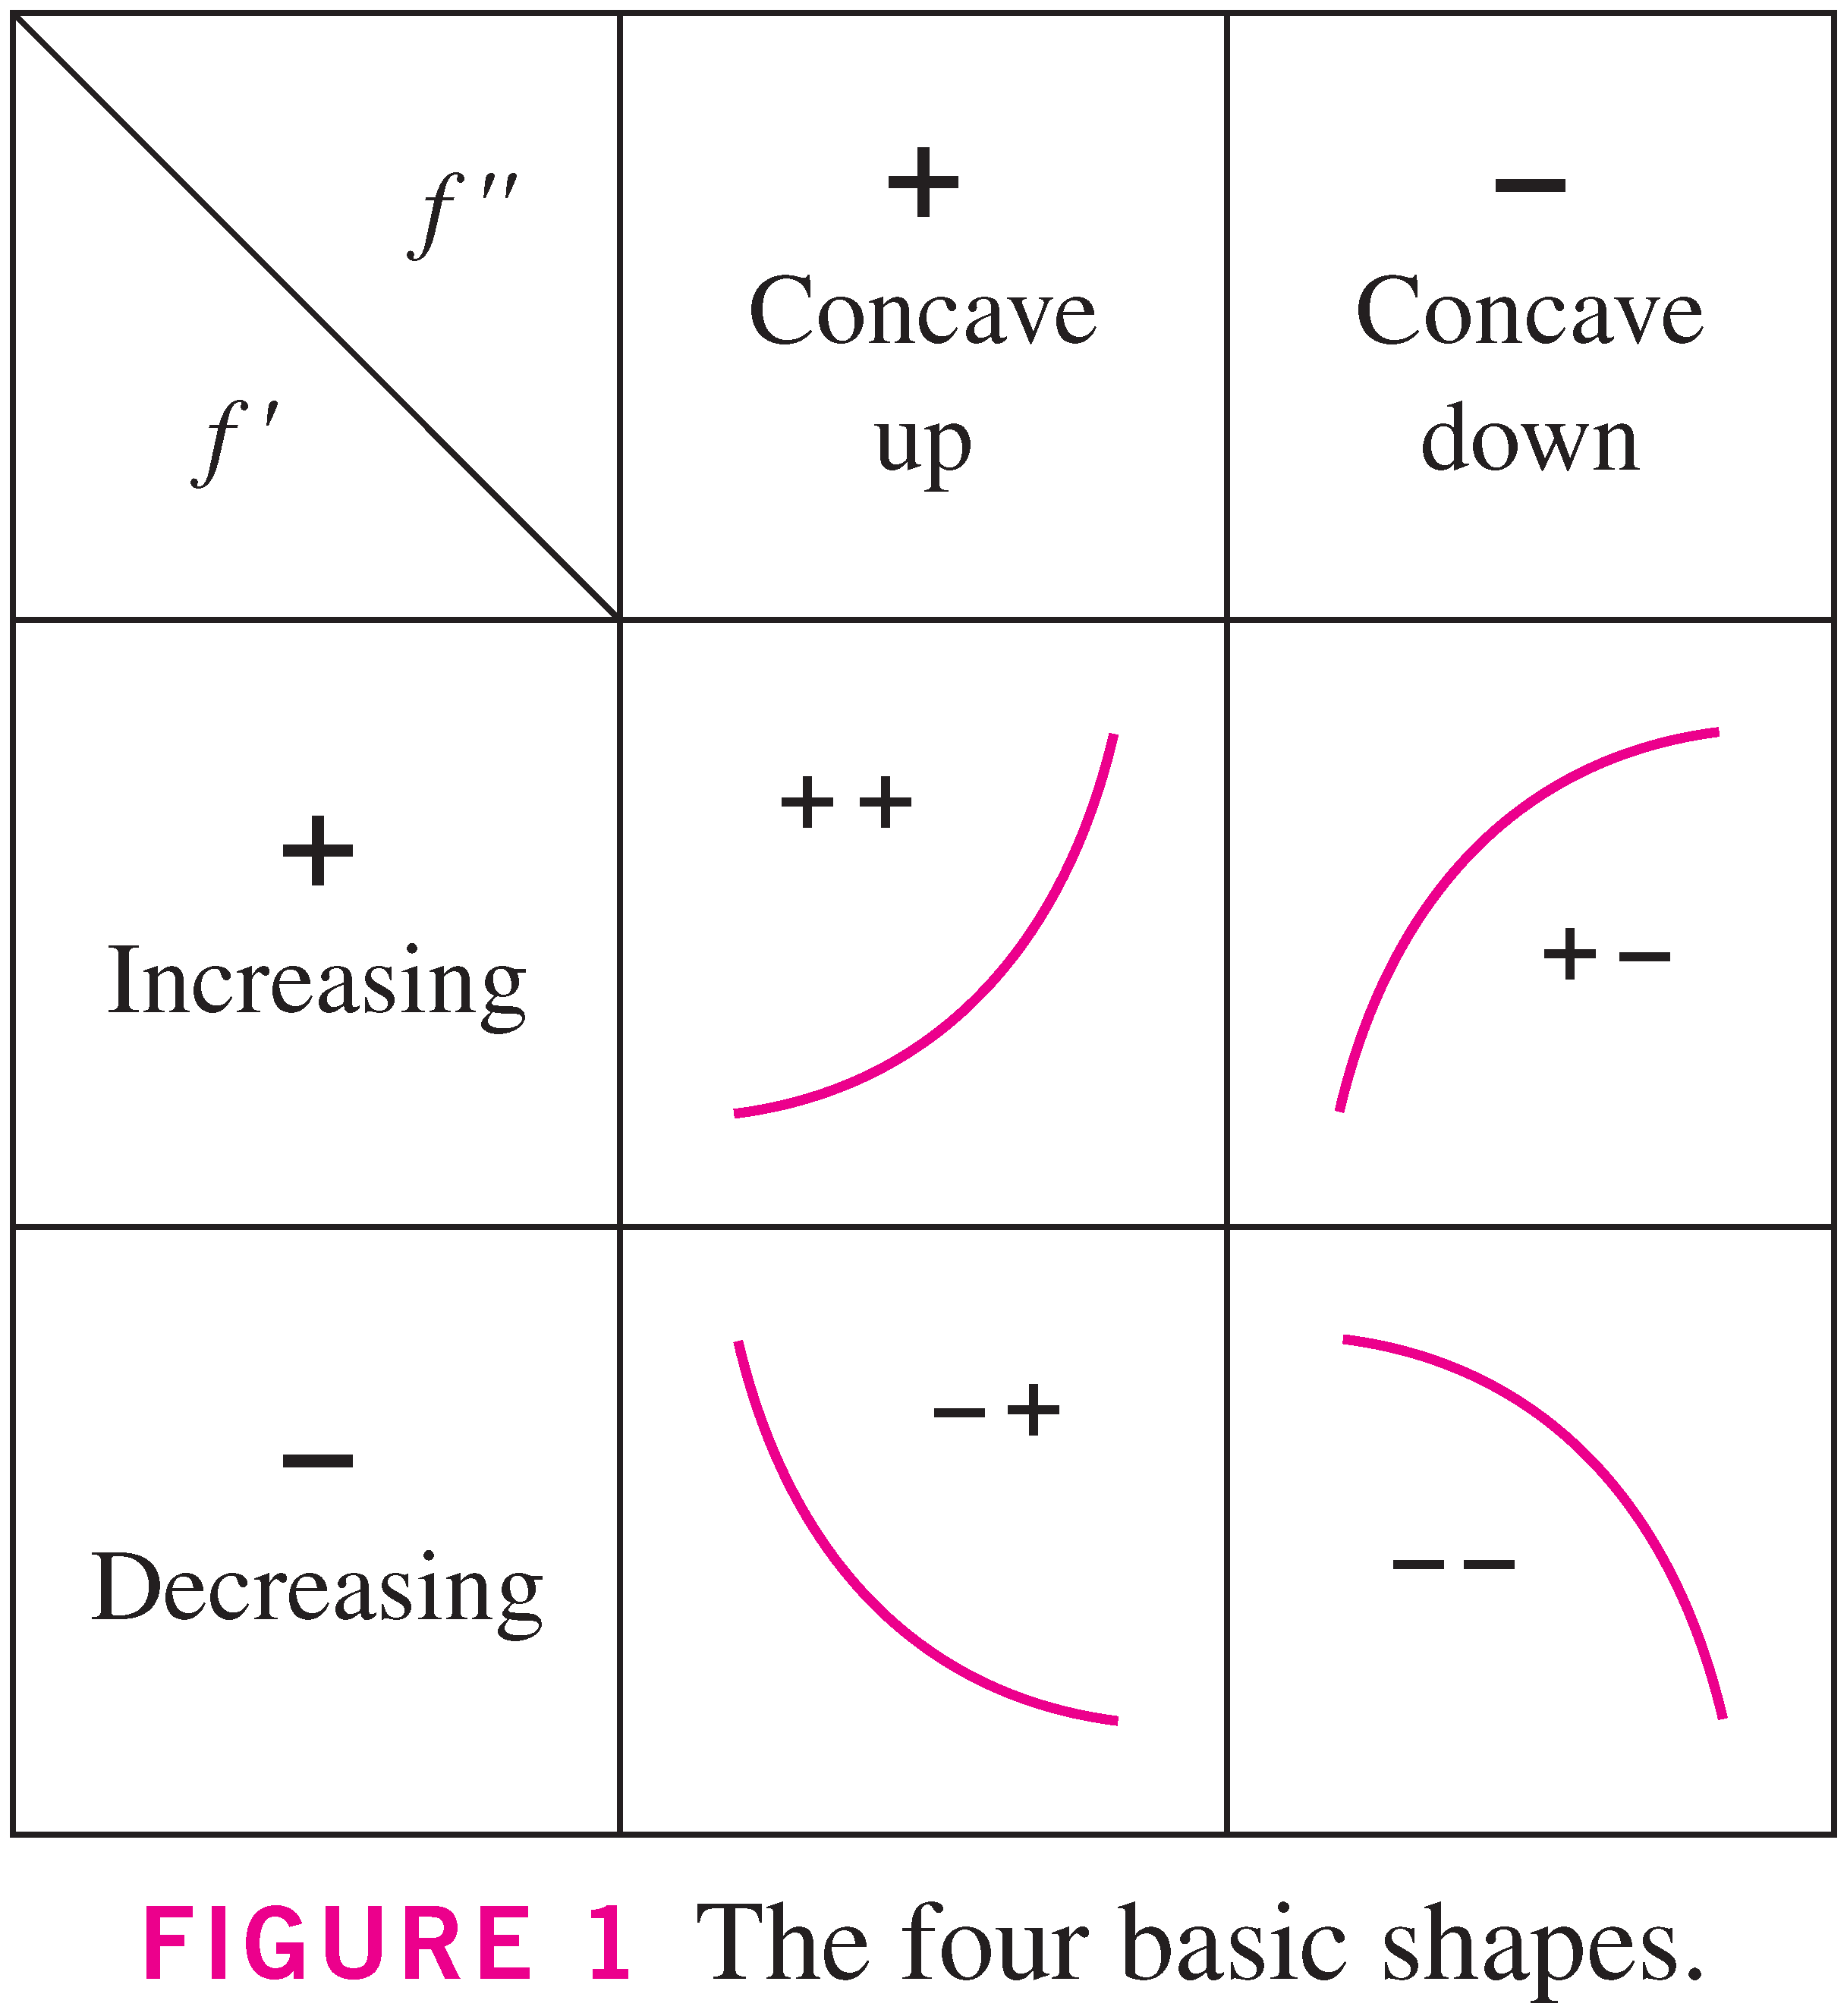
- Here's a summary of the concavity stuff we did last time:
Four major cases:
- Asymptotic behavior (as we approach infinity)
Behavior is similar for broader classes of functions (e.g. Example 6, p. 212)
- We now have everything we need to create a great table to summarize
your study of a function, in preparation for graphing it. It's different from
the table in the book, however (although all of the information is essentially
the same). The following are the elements that we want to include:
- Domain of the function
- function values at endpoints of intervals
- function zeros
- critical points
- monotonicity (increasing/decreasing)
- concavity
- extrema
- inflection points
- asymptotes (vertical and horizontal)
- Determine the domain of f.
- Determine symmetry of f (if any).
- Determine the critical values (zeros of f')
- Determine the zeros of f'' (looking for inflection)
- Draw a real number line, and indicate the "interesting" parts of the domain on the line.
- Below the line are three lines for f, f', and f''. On each line mark places where the corresponding function is either zero or undefined (with double vertical bars).
- Indicate the sign of each function between zeros and bars.
- Use the four "canonical" function shapes to indicate the shape of the function for each sign combination of f' and f''.
- Describe asymptotic behavior
- Examples:
- #61, p. 218
- #40, p. 217
- #79, p. 218
- Questions over the Directed reading handout, Section 4.5 (html) (pdf)?

