Today:
- Quiz 4
- Chapter 4, sections 1-4: the normal distribution
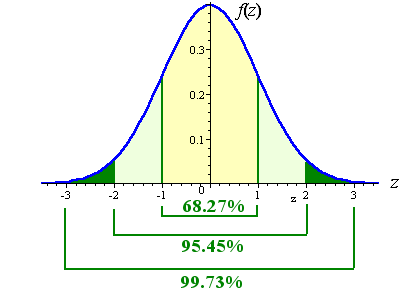
- Figure 4.4, p. 105 and the Empirical Rule
- Percentages in categories
- Percentages over categories
- Practical Example:
Problems A, B of Chapter 4
Example
- What do we do with Problem C?
- Example: #3, p. 108
- Z-statistic
- The definition:

- "Z table" (p. 111)
- Deducing/refining the empirical rule

- Using the Z table to do problems:
- Percentage/fraction/probability (p. 123)
-
Normal areas applet
- probability
calculator
- All probabilities are between 0 and 1
- A probability of 0 means that an outcome of interest will
never occur.
- A probability of 1 means that an outcome of interest is
certain to occur.
- #8, p. 126
- Using the Z-table backwards:
- Section 4.5: using the normal to make inferences
- Someone makes a claim: does it make sense? How can we tell?
-
- A common rule:
- If the probability of an observed sample is .05 (1/20) or
less, assuming the truth of some conjecture, then the sample is contradictory
to that conjecture. Otherwise the sample will not be considered contradictory
to the conjecture.
- Strategy: Inference making procedure, p. 136
- Example: #3, p. 137
- Section 5.1: Sampling distributions and the normal curve (why is the
normal distribution so important?)
- Generally we pull many values from a population to form a
sample.
- A statistic is a number that we calculate from a
sample of data.
- A parameter is a number that could be calculated
from a population if all of the data were accessible:
- It turns out that if we take sample after sample, and compute the
statistic over and over, the histogram of statistic values will look
bell-shaped.
- This result is encapsulated in The Central Limit Theorem
(p. 167), and in the graphs of Figure 5.3, p. 168.
- Links
Website maintained by Andy Long.
Comments appreciated.

