- More good news: paired comparisons will turn out to be exactly
like our first encounter with estimating
in a single sample. So if you understood that, great!
(Compare pages 346-347 with 290.)
- From our pairs of quantitative data, we create a new variable: the
difference. So we form differences
and then we work with this data, this random variable d.d1=x1-y1, d2=x2-y2, ..., dn=xn-yn - Notation:
: Population mean : Population Standard Deviation : Sample Mean : Sample Standard Deviation : Sample size (number of pairs) - Then Confidence Intervals and Hypothesis Testing are just as they
were for single population samples (see pp. 346-347). One modest difference is
that hypothesis tests are essentially always of the form
- Examples (using StatCrunch):
- Example 9.8, p. 352 (http://www.nku.edu/~statistics/data/exam09-08.xls)
- #1, p. 354 (http://www.nku.edu/~statistics/data/c09s03e01.xls)
- #4, p. 354 (http://www.nku.edu/~statistics/data/c09s03e04.xls)
- Analysis of Variance (ANOVA) F-test: A comparison of
k population means (p. 403)
Decision rule: Accept Ha if p-value < Test Statistic: - Conditions of using an F-test (p. 404):
- Completely randomized design to collect the k samples
- All k populations are normally distributed
- All k populations have the same (unknown) standard
deviation
- The F-distribution
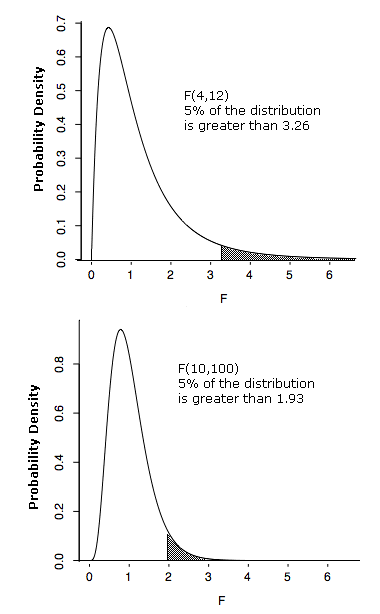
- Is skewed right:

- Calculation requires knowing degrees of freedom, numerator and denominator -- yikes!;) You won't have to worry about this if you use technology.... The curves above correspond to different pairs of df, and the .05 rejection region.
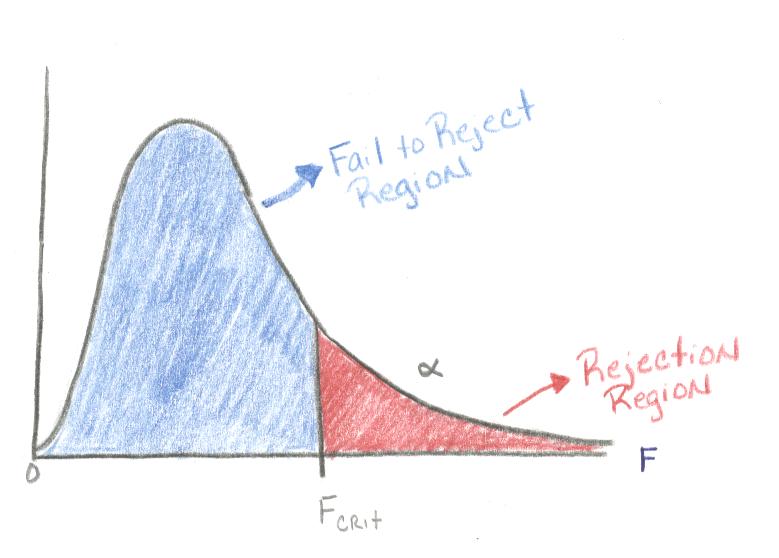
- Large values of F signify that it's unlikely that the
means are the same (reject the null!). As you can see,
p-values are in the tail area:

- Is skewed right:
- Examples:
- Example 10.2, using StatCrunch: http://www.nku.edu/~statistics/data/exam10-02.xls
- #2, p. 413 (with handout): http://www.nku.edu/~statistics/data/c10s02e02.xls
- M&Ms and the F-test
- #1, p. 413: http://www.nku.edu/~statistics/data/c10s02e01.xls
- A t-test is equivalent to an F-test (gives the same p-value): #6, p. 341 (http://www.nku.edu/~statistics/data/c09s02e06.xls)