Chernoff Faces
 Chernoff Faces |
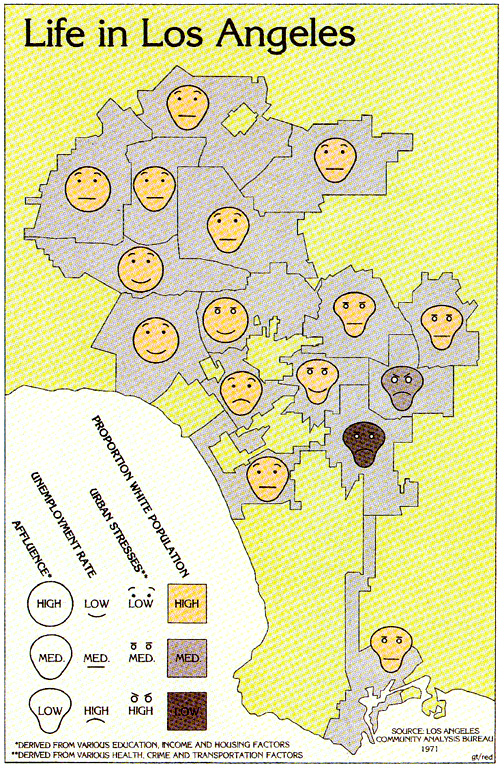
They use facial features to represent trends in the values of the data, not the specific values themselves. While this is clearly a limitation, knowledge of the trends in the data could help to determine which sections of the data were of particular interest.
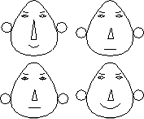
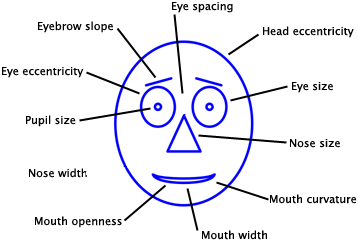
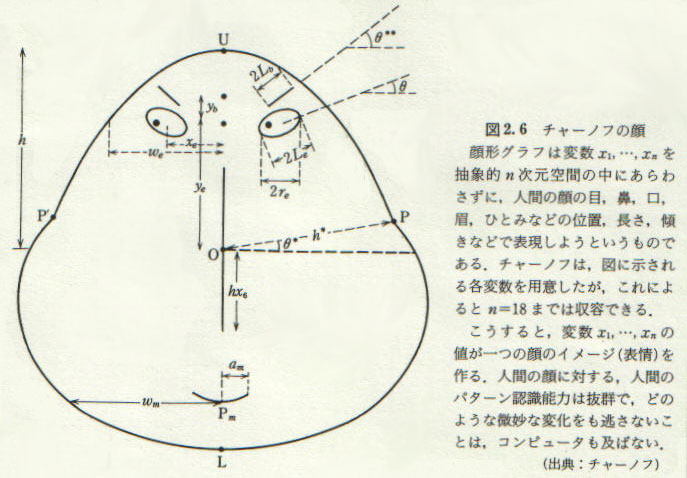
Here, the faces are described by 10 facial characteristic parameters: 1. head eccentricity, 2. eye eccentricity, 3. pupil size, 4. eyebrow slant, 5. nose size, 6. mouth shape, 7. eye spacing, 8. eye size, 9. mouth length, and 10. degree of mouth opening. Each parameter is represented by a number between 0 and 1.
|
All 0. |
All 0.5. |
All 1. |
Randomly selected parameters. Change face. |
Animation with random parameters. |
The power of Chernoff face is its high condensation of data and its
interesting way of presentation. Scott
(1992) found that repetitious viewing of large tables of data is tedious,
but Chernoff faces can significantly improve data digestion.
A major drawback
of Chernoff faces is that the subjective assignment of facial expressions to
variables affects on the shape of the face. Chernoff
and Rizvi (1975) found that the permutations of the assignment of features
caused an error rate of as high as 25 for the task of classifying faces into
groups.

 It means that classifying two faces as "fairly similar" is greatly
influenced by the assignment of variables to specific features. Furthermore,
some researchers such as Flury
and Riwdwyl (1981), and Turner
and Tidmore (1980) criticized that the symmetrical feature of Chernoff
faces is redundant. Like the "star graph" or "radar plot", the power of showing multiple
relationships in Chernoff faces are limited in a still mode. With the advance
of computer technology, animated Chernoff faces may be worthy to experiment
with. [Yu]


