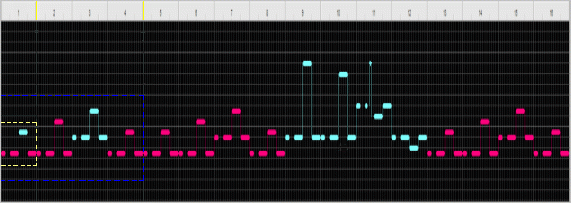
In this piece, each B section consists of a note or set of notes whose tonal center (home base note) is higher in pitch than that of the surrounding A sections.

This map represents 16 measures of music, with each horizontal increment marking one beat. Each light blue region represents a group of notes that, on the whole, sound higher than the surrounding notes (their average pitch is higher).

This is a graph of the actual bass line. The x-axis is time and the y-axis is pitch.
The light blue segments correspond the first instance of a high region at each of the three scales of measurement. The yellow and blue dashed lines mark the first measure and the first four measures, respectively.
| "Funky Cantor" |