- Quiz over T-Test returned
- Why do we need a T, rather than a Z? We don't know
- When you describe the distribution, tell me how each variable is distributed along the real line! I.e., talk about the shape of the curve which gives the probability that the statistic would be found at any particular real value.
- Why do we need a T, rather than a Z? We don't know
- Quiz over inferences about two population means
- Analysis of Variance (ANOVA) F-test: A comparison of
k population means (p. 403)
-
-
- Decision rule: Accept Ha if
-
Test Statistic:
-
- Conditions of using an F-test (p. 404):
- Completely randomized design to collect the k samples
- All k populations are normally distributed
- All k populations have the same (unknown) standard
deviation

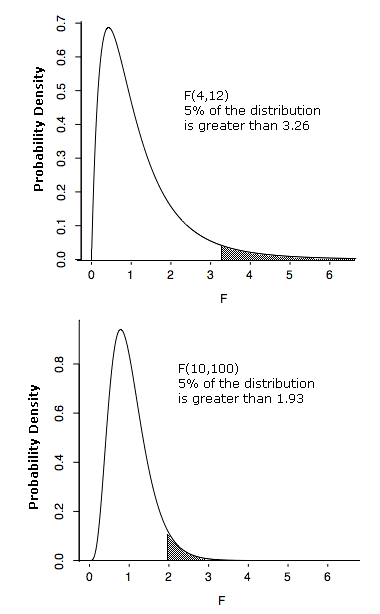
- The F-distribution
- Is skewed right:

- Calculation requires knowing degrees of freedom, numerator
and denominator -- yikes!;)
- The numerator degrees of freedom refer to the number k of populations (e.g. treatments) under consideration (df=k-1)
- The denominator degrees of freedom refer to the difference in the number N of samples of all the populations under consideration, minus the number k of populations (df=N-k)
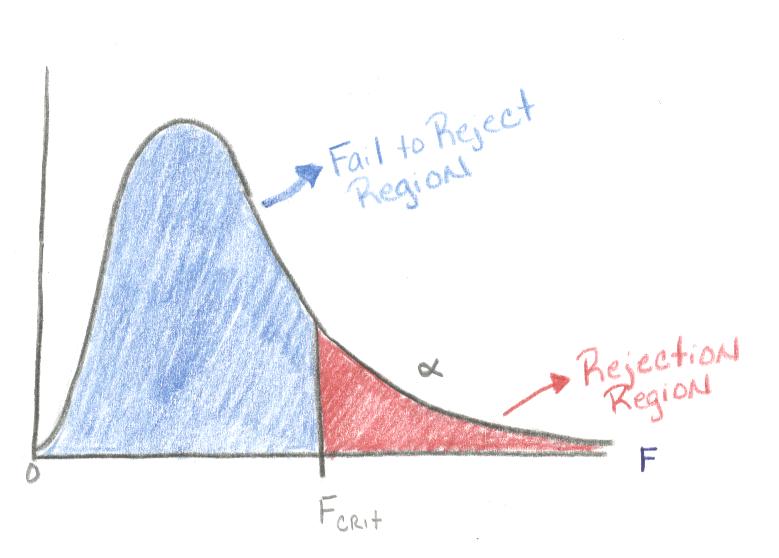
- Large values of F signify that it's unlikely that the
means are the same (reject the null!). As you can see,
p-values are in the tail area:

- Is skewed right:
- Examples:
- on-line example with nice graphs
- Example 10.2, using StatCrunch: there's a graphic on p. 405 that gives a good interpretation.
- #2, p. 413 (with handout).
- #1, p. 413
- A t-test is equivalent to an F-test (gives the same p-value): #6, p. 341
- Now: you asked for it, and they're back! M&Ms and the F-test:
orange green red yellow blue brown
- The F-test indicates that there is at least one pair of means that
differ: what now? Multiple comparisons....
- We do a t-test on each pair (see page 417), although you won't be
required to do these. The analysis table will be presented, as
in the following example.
- Example: #2,
p. 413 (with
handout). The "Tukey HSD with confidence level" option in
StatCrunch effectively gives us the same information as the
"multiple comparisons" results in the handout (HSD stands for
"Honestly Significant Differences").
- The Up-shot: the more tests (comparisons) that are carried out, the more likely that one will be significant by chance (probability of a type I error)
- Let's look at the web example to get started: example from website
- Here's how to do a chi-square in StatCrunch (using this data)
- A look at another example, in StatCrunch.