- Date
- Question
- Group member names
- Solution strategy or strategies proposed.
- Analysis of the process.
Consider this data, concerning diagnoses of HIV and other sexually transmitted diseases among homosexual men (from Macdonald, (2004). Recent trends in diagnoses of HIV and other sexually transmitted infections in England and Wales among Men who have Sex with Men -- MSM -- here's a local copy):
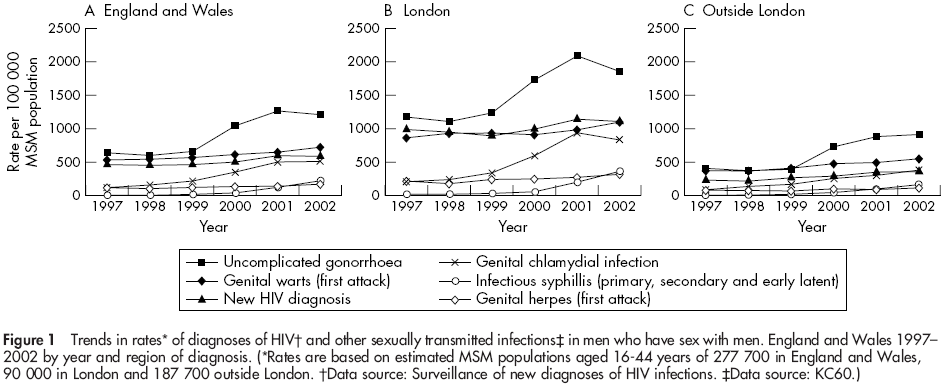
Here are my digitized data, for the years 1997-2002 (for "uncomplicated gonnorhoea" in London):
| 1997 | 1200 |
| 1998 | 1100 |
| 1999 | 1250 |
| 2000 | 1750 |
| 2001 | 2100 |
| 2002 | 1800 |
- How do you think the authors created the curves (graphs of
continuous functions) connecting the data points?
- Once again: what do the areas under the curve
mean (for "uncomplicated gonnorhoea" in London, say)?
What is the scientific importance of the area? What are the
physical units of the area under the curve?
- Create several different Riemann sums for the area under the curve
of the rate of "uncomplicated gonnorhoea" in London, for the
years 1997-2002. Which do you like the best?
If you look at the definition of the Riemann sum (a function of three variables! See p. 262), you see that there are three things you can alter to create a different Riemann sum: the function f, the partition P, and the choice of representative points on each subinterval (C).
-
Write each of your answers in part 3 as definite integrals;
- Suppose that you were interested in breaking out your
analysis, so that it covered the two periods
1997-2000, and 2000-2002. What would you want to
assert about the integrals
,
, and
- Once again, why can we not immediately and thoughtlessly push to
the definite integral, as defined on page 263?