 |
 |
This series is for Lome, which I knew would experience much rainfall throughout the year, and so might be a good example. Things will get dicier in Dapaong...
I might begin by mentioning that this is for the original, uncleaned data.
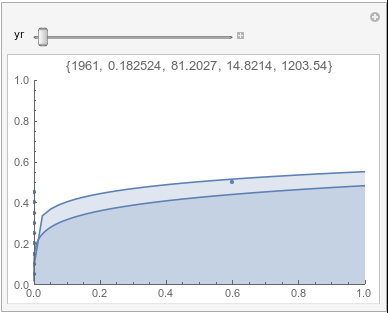
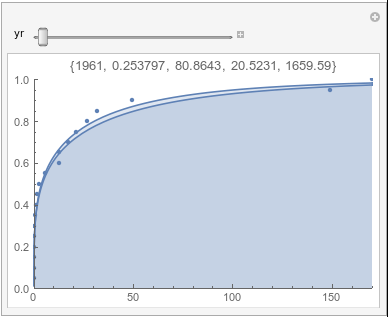
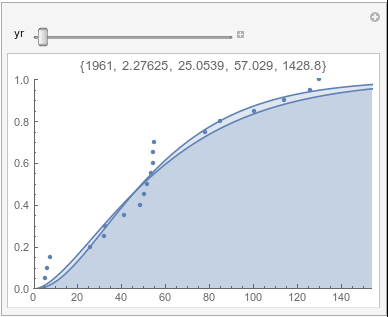
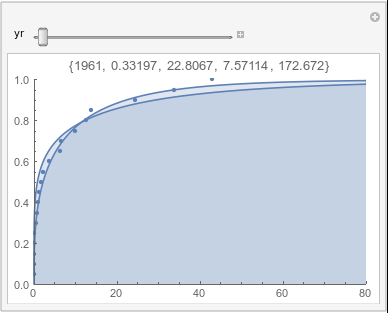
In each animation for a particular month, you'll see the best-fitting gamma distribution for all the data for that month, and then you'll watch as I sub-select data 20 years at a time, for the periods 1961-1980 through 1996-2015, and refit the gamma.
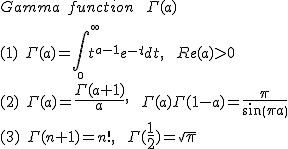
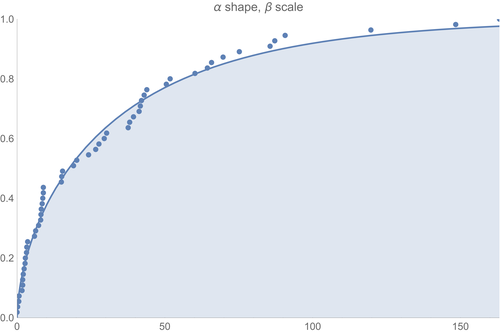
A gamma distribution has a probability density function (pdf) of the form \[ \gamma(x;\alpha,\beta)= \frac{e^{\frac{-x}{\beta}}x^{-1+\alpha}}{\Gamma(\alpha)\beta^\alpha} \]
The gamma function appearing in the denominator ($\Gamma(\alpha)$) is an extension of the factorial function (n!=$\Gamma(n+1)$) to non-integer values:
|
|
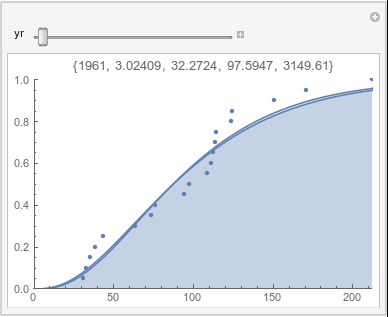
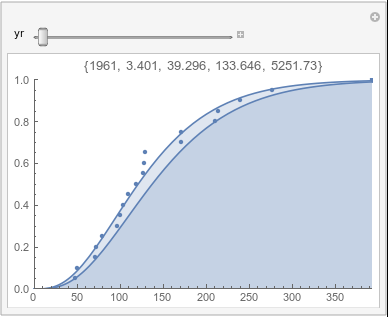
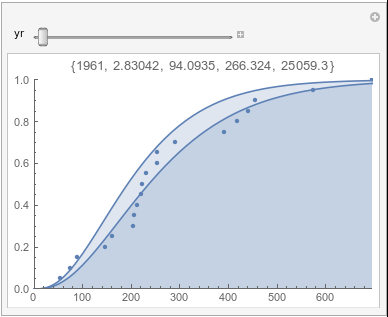
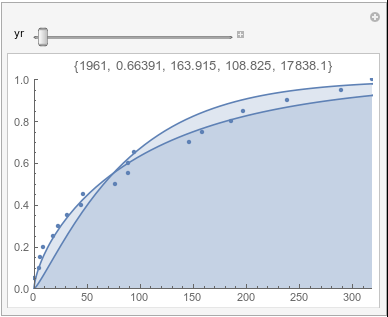
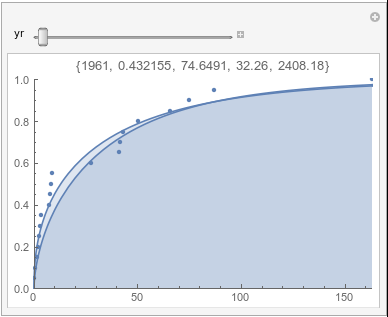
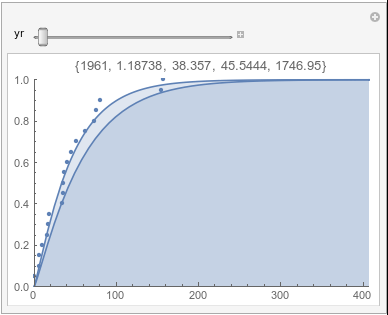
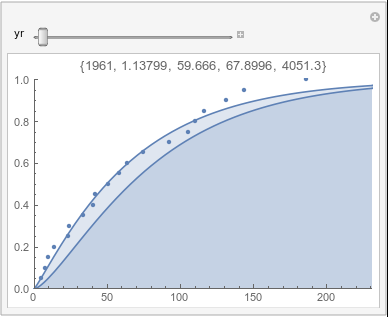
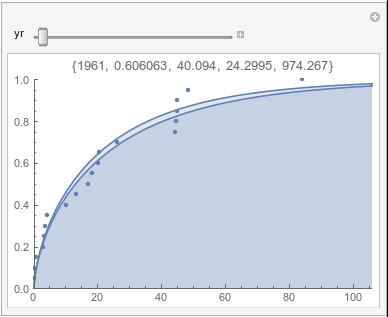
If there were no trend in time, then the 20-year gammas would bounce randomly around the "grand gamma" (let's call it the "grandma";). But you'll notice that there are trends. But how would you characterize them? And how do you quantify them?
Here are some "grandmas" for June, July, and August:
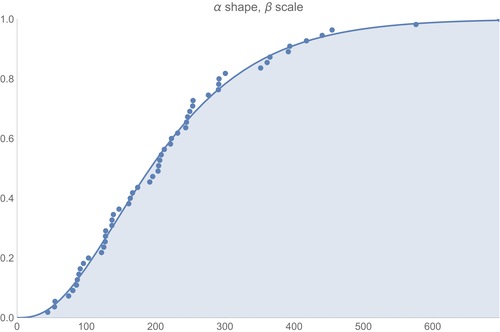
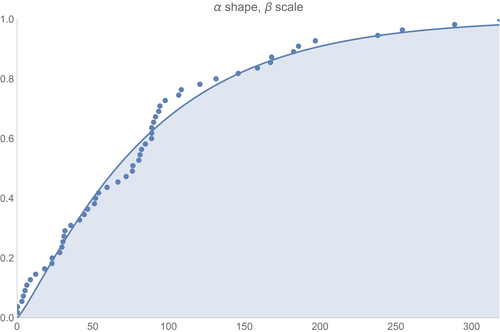
Now I'm using data that hasn't been cleaned in the slightest, so things may change once we get Lome all cleaned up (and if you knew Lome, then you'd know that it may be awhile before we get Lome all cleaned up!:).
 Lome: January |
 Lome: February |
 Lome: March |
 Lome: April |
 Lome: May |
 Lome: June |
 Lome: July |
 Lome: August |
 Lome: September |
 Lome: October |
 Lome: November |
 Lome: December |