- There will be a short quiz at the end of the hour.
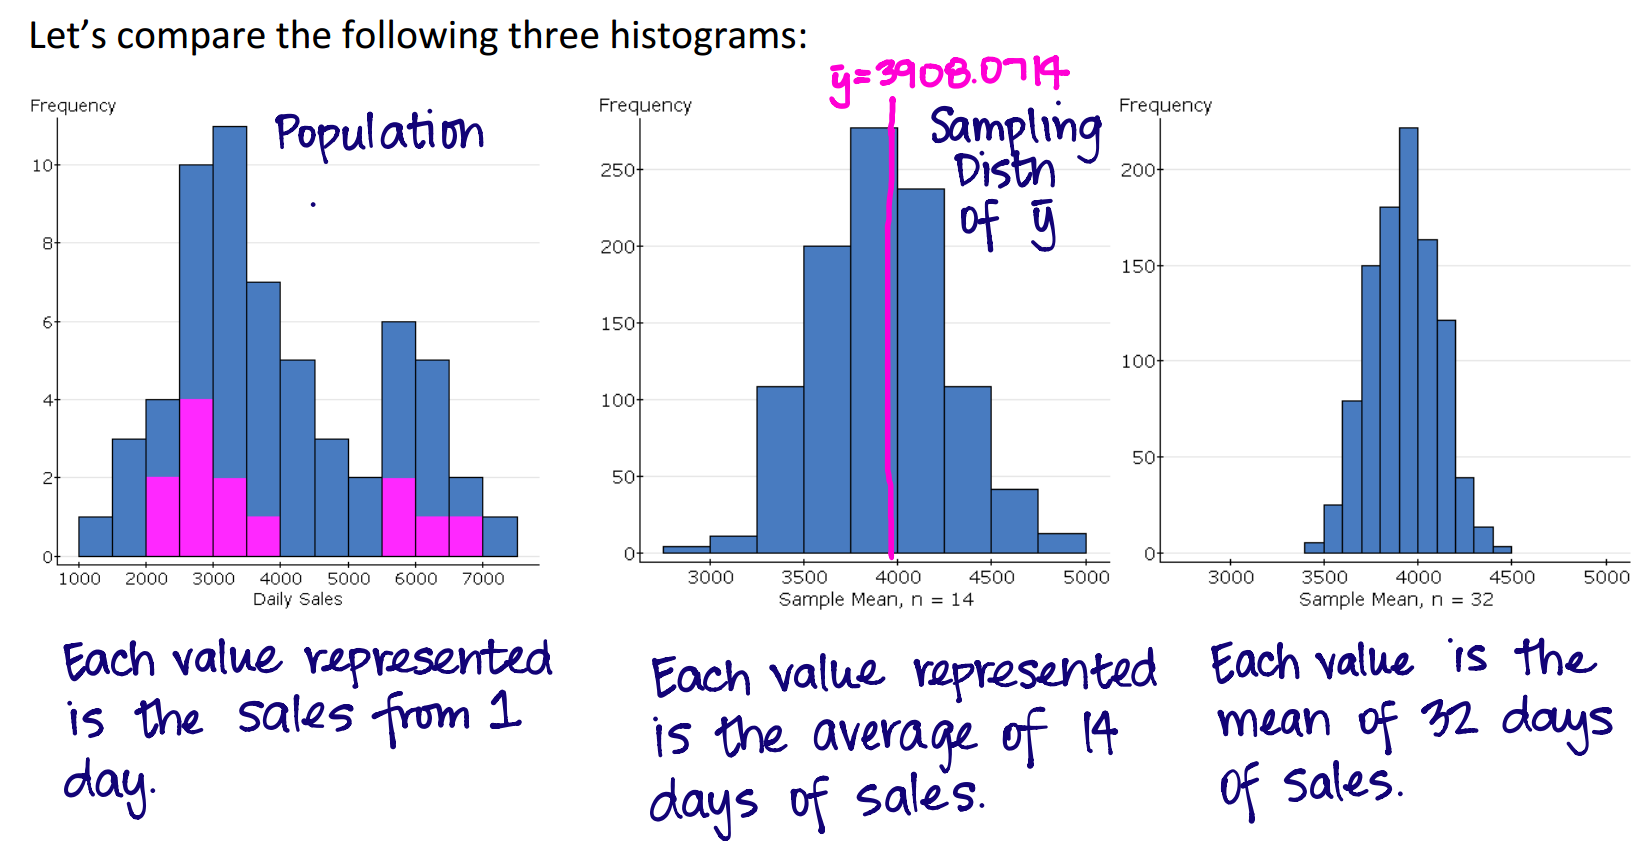
- Chase came to visit with me, and we found a couple of nice figure
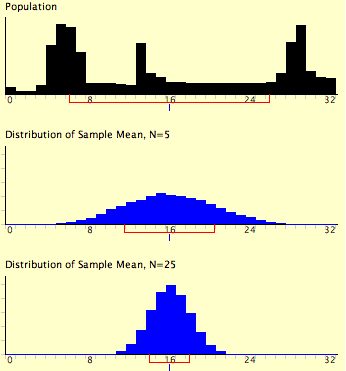
to explain what we're up to in this packet:
We start with a wonky distribution for $y$ (top); with increasing sample size, the distribution of $\overline{y}$ becomes more normally distributed, and as $n$ increases, more normal with smaller spread.


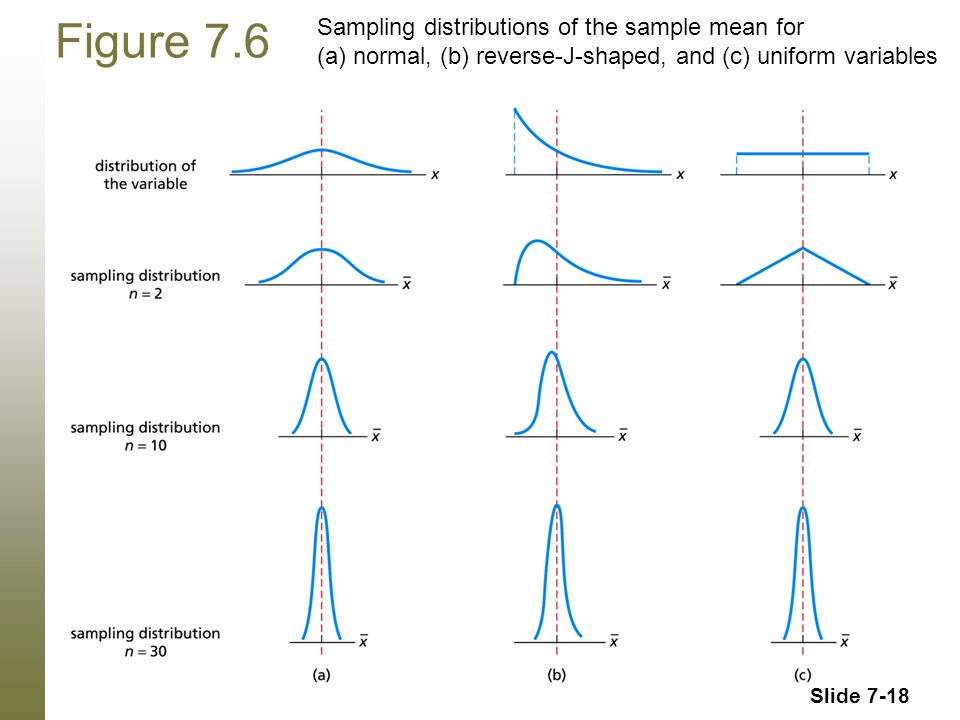
- One more (from Brooke):

By taking samples of multiple variable values, and turning them into sample means, the original distribution (which was far from normal) morphs into the normal distribution, tucked about the mean of the original variable, with a standard deviation which decreases with increasing sample size.
- Today we'll wrap up Packet 8: Sampling Distribution of the Sample Mean.
- The Standard Normal Table of probabilities.
- Computing chi-squares in Statcrunch is carried out using the
Stat -> Tables -> Contingency ->
(then either data or summary, depending on what you have)
- Here's a Mathematica demo about Chi-Squares.