- Reminder: please hide your rectangles.
- Your quizzes are returned.
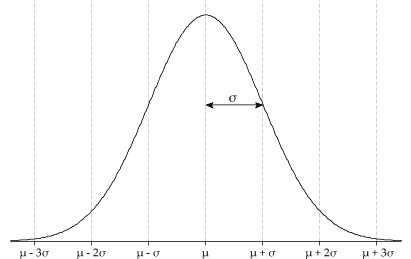
- Once again, I'm checking that you can actually draw a reasonable normal curve. One thing I'm seeing is that some of you don't seem to understand what $\mu \pm \sigma$ represents. Those are values of the distribution exactly one standard deviation $\sigma$ away from the mean $\mu$.
They are points along the $x$-axis, to the right and to the left of the mean $\mu$ (the $x$-value directly below the peak of the bell):

You want to be able to draw this picture. This beautiful drawing makes your work better, and your intuition better. The $z$-score (standardized score) just tells you the number of standard deviations from the mean -- so it tells you how many "$\sigma$-steps" you are from $\mu$.
- Definitions:
- The population is the set of all observational units for which an inference is desired.
- The sample is the subset of the population from which data is actually collected.
- The data is usually either categorical, or quantitative:
- Categorical data is data from only a small (finite) number of categories;
- Quantitative data is numerical data, for which averages make sense.
(So the roll of a die isn't really quantitative -- the average (3.5) is not a possible roll of the die.)
- Once again, I'm checking that you can actually draw a reasonable normal curve. One thing I'm seeing is that some of you don't seem to understand what $\mu \pm \sigma$ represents. Those are values of the distribution exactly one standard deviation $\sigma$ away from the mean $\mu$.
- Your homework over this packet is due Wednesday of next week (you also have an assignment due tomorrow).
- Please watch Brooke's Sampling
distribution of the sample proportion at some
point. It will help you finish off Packet 3.
- StatCrunch instructions for packet 2 (and for IMath homework, more generally, that involves Statcrunch):
- Load the Stop
and Frisk Data for packet 2. Click on My Data,
then "Upload data set".
Under "Select data source", choose "WWW address", and make sure to set the delimiter to "comma" (because this is a "csv" (comma-separated values) file.
- Once the data is loaded, click on "Graph" or "Table".
- Alternatively, you may want to join my "group" on Statcrunch. That way you can access the data more quickly. It's Sta205-Long, if you want to add yourself into that group.
- For the IMath homework, you'll need the Bipolar Depression Study data. Same thing: Load it by "WWW address", and make sure to set the delimiter to "comma" (because this is a "csv" (comma-separated values) file (or get it from the group).
- Load the Stop
and Frisk Data for packet 2. Click on My Data,
then "Upload data set".
- What's so sexy about math?: Hidden truths permeate our world; they're inaccessible to our senses, but math allows us to go beyond our intuition to uncover their mysteries. In this survey of mathematical breakthroughs, Fields Medal winner Cedric Villani speaks to the thrill of discovery and details the sometimes perplexing life of a mathematician. "Beautiful mathematical explanations are not only for our pleasure," he says. "They change our vision of the world."
(This video features the normal curve, at minute 2:25. "It is the supreme law of unreason.")