Exponential Functions
Graphing Part II: Graphs of Transformed Exponential Functions
Nature sometimes gives us problems that cannot be modeled using the basic exponential,
f(x) = a x.
Most look a bit more complicated, such as this function that we will see when we discuss Newton's Law of Cooling:
T (t) = Te + (T0 − Te ) e − kt
This example illustrates how we often need to transform the most basic exponential function to suit the needs of a specific problem. These graphical transformations include stretches, shrinks, and reflections.
Consider the following mathematical problem:
How would you graph the function g (x) = Ca x, where C > 0?
To answer this, think about how g (x) differs from the base function f (x) = a x. Recall from the TRANSFORMATIONS SECTION that the constant C > 0 vertically stretches or shrinks the graph of f (x).
The figures below show both a vertical stretch and shrink.
|
|
Vertical Stretch
|
Vertical Shrink
|
Common Features of Vertically Transformed Functions Notice that the y-intercept in each of these examples has moved from (0,1) for f (x) = a x to (0,C) for g (x) = Ca x. |
|
Go to A Shodor activity with the capability of plotting data points as well as a function. You can tweak the function to fit the data.
Now let's examine another type of transformation- reflection across the x-axis.
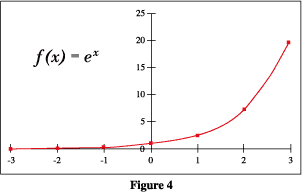
What does the graph of the function h (x) = e -x look like?
Again, ask yourself, "How does the function h (x) compare to the base function
f (x) = e x ?". Recall from the graphical transformations section that the negative sign attached to the x indicates a reflection across the y-axis. Therefore, the graph of h (x) = e -x should look exactly like the graph of f (x) = e x, reflected across the y-axis.
Examine the graphs below.
|
|
|
|
In
the next section we will discuss the implementation of exponential functions
as models for various phenomena.
The Biology Project > Biomath > Exponential Functions > Graphing Part II
Department of Biochemistry and Molecular Biophysics
The University of Arizona
December 2005
Contact the Development Team
http://www.biology.arizona.edu
All contents copyright © 2005. All rights reserved.


