1.1 Related Variables

Checkpoint 2

The data in Table C1 were gathered by a team of two students in a physics lab. Each used a motion detector to measure, at a number of closely spaced times, the distance a falling object had traveled. Times that appear twice in the table were selected by both students, and each selected some times not used by the other. The scatter plot for these data is shown in Figure C1.

  1. Do you think there should be a relationship between time and distance for an object falling in a gravitational field?

  2. Does the scatter plot confirm or deny a relationship?

Table C1   Falling body data
Time
(seconds)
Distance
(centimeters)
 
Time
(seconds)
Distance
(centimeters)
0.16
12.1
 
0.57
150.2
0.24
29.8
 
0.61
182.2
0.25
32.7
 
0.61
189.4
0.30
42.8
 
0.68
220.4
0.30
44.2
 
0.72
254.0
0.32
55.8
 
0.72
261.0
0.36
63.5
 
0.83
334.6
0.36
65.1
 
0.88
375.5
0.50
124.6
 
0.89
399.1
0.50
129.7
     
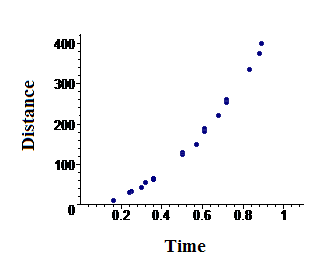
Figure C1   Scatterplot of falling body data