Chapter 1
Relationships
1.3 Terminology
Problems
If you need graph paper for these problems, click on the image at the right to open a page from which you can print. Start each graphing problem by labeling and scaling your axes in a way that is reasonable for that problem. Use a full sheet of graph paper for each Problem.
For each of the relationships in Problems 1 – 16 :
- Determine whether the relation is or is not a function, and explain why you think it is or is not.
-
If the relation is not a function, can you think of additional conditions you could impose on the description that would make it a function?
- If the relation is a function, describe its domain and a rule for determining its values.
- If the relation is a function, is it a function of time? Explain.
- The height of a baseball after being hit into the air.
- The speed of an egg dropped from the tenth floor of a building.
- The height of an individual as he or she ages.
- The amount of time it takes a person to run a mile as he or she ages.
- The amount of money in a savings account over an extended period of time.
- The size of a person's vocabulary from birth onwards.
- The number of bacteria in a laboratory culture over a period of time.
- The daily high temperature at your local airport over a calendar year.
- The number of students absent from class and the day of the academic year.
- The temperature of an ice-cold drink left in a warm room over a period of time.
- The number of hours of daylight and the day of the year.
- The cost of a pizza and the diameter of the pizza.
- A safe following distance for your car at a given speed.
- Ideal weight at a given height, as represented by a chart in your doctor's office.
- The income tax on a given taxable income.
- The sales tax on a given purchase.
Table P1 Related variables `x`0.81.53.22.61.92.43.50.62.1`y`0.72.110.56.83.55.912.40.34.3- Make a scatter plot of the data in Table P1. (You may have done this already.)
- Explain why the table defines a function.
- What is the domain of this function? What is a rule for the function?
Table P2 Distance traveled by a falling object Time (seconds)12345678910Distance (meters)5194478123176240313396489- Make a scatter plot of the data in Table P2. (You may have done this already.)
- Explain why the table defines a function. What is a function of what?
- What is the domain of this function? What is a rule for the function?
-
 Some thermometers measure temperatures on both Fahrenheit and Celsius scales. These side-by-side scales suggest a functional relationship.
- Define Fahrenheit temperature as a function of Celsius temperature by a simple formula.
- Now express Celsius temperature as a function of Fahrenheit temperature.
- Graph both these functions. Would you describe either of these functional relationships as “linear”? Why or why not?
- Is there a temperature that is assigned the same number on both the Fahrenheit and Celsius scales? If so, what is it, and how do you find it? Is it a high temperature, a low temperature, or an in-between temperature?
-
Consider the relationship between the amount of money earned on a part-time job and the number of hours worked.
- Identify the two quantities that vary, and decide which should be represented by an independent variable and which by a dependent variable.
- Sketch a reasonable graph to show a possible relationship between the two variables. (You should be concerned only with the basic shape of the graph, not with particular points.)
- Write a sentence or two to justify the shape and behavior of your graph.
- Determine whether the relation is or is not a function, and explain why you think it is or is not.
- If the relation is not a function, can you think of additional conditions you could impose on the description that would make it a function?
- If the relation is a function, describe its domain and a rule for determining its values.
- Consider the relationship between the postage on a first class letter and the weight of the letter. (If you are not sure about the current postage rates, visit the US Postal Service.)
- Identify the two quantities that vary, and decide which should be represented by an independent variable and which by a dependent variable.
- Sketch a reasonable graph to show a possible relationship between the two variables. (You should be concerned only with the basic shape of the graph, not with particular points.)
- Write a sentence or two to justify the shape and behavior of your graph.
- Determine whether the relation is or is not a function, and explain why you think it is or is not.
- If the relation is not a function, can you think of additional conditions you could impose on the description that would make it a function?
- If the relation is a function, describe its domain and a rule for determining its values.
- In the example of speed of a car (measured by the speedometer) as a function of time (measured by the dashboard clock), what is the domain of the function? What is a rule for the function?
- Besides the speedometer, what other device on the dashboard of a car expresses some quantity as a function of time? What quantity is so expressed?
- When you are driving a car, is time a function of speed? Why or why not?
- Figure P1 shows the annual rainfall amounts at Raleigh-Durham airport (central North Carolina) over more than 50 years, along with the average annual amount (about 42 inches) over that period. Was the decade of the 1990's unusually dry, unusually wet, or about average? What about the decade of the 1980's?
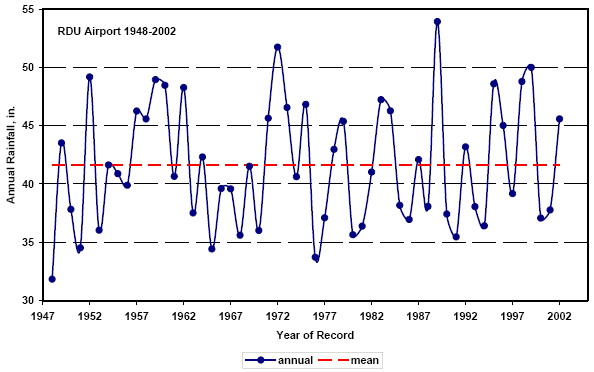
Figure P1 Annual Rainfall Variability
-
- Sketch a graph of speed as a function of time for a typical trip to get a pizza — one way or round trip, but be sure to explain your graph.
- Sketch a graph of distance traveled for the same run, also as a function of time.
- What function of time is measured by the odometer in a car? Is the measurement discrete or continuous? Is the function itself discrete or continuous? Explain your answers in each case.
-
Consider the situation described in this sentence: The child's temperature has been rising for the last two hours, but not as rapidly since we gave her the antibiotic an hour ago. Sketch a graph of temperature as a function of time, consistent with the situation described.
Adapted from Calculus Problems for a New Century, edited by Robert Fraga, MAA Notes Vol. 28, 1993.
-
Every ten years, the U.S. Census Bureau attempts to count the population of the United States. The results of these efforts are shown in Table P3.
Table P3 US Census Data, 1790-2000
Source: US Census BureauCensus Date179018001810182018301840185018601870Population (millions)3.9295.3087.2409.63812.86617.06923.19231.44338.558Census Date188018901900191019201930194019501960Population (millions)50.18962.98076.21292.228106.022123.203132.165151.326179.323Census Date1970198019902000Population (millions)203.302226.542248.710281.422- On graph paper, make a scatter plot of the data in Table P3.
- What are the independent and dependent variables in the table and in your graph? Do the census data represent a function? If so, what is a function of what? What is the domain? What is a rule for the function?
- Use the graphical information in your scatter plot to sketch your own idea of the real U.S. population function over the continuous time interval from 1789 to the present.
- Do you see your graph as being continuous or discrete? Why?
- Now imagine a view through a high-powered microscope of a very small portion of your graph, say, between 2:30 P.M. and 3:17 P.M. last Wednesday. Sketch what you think this microscopic view should look like. Is this graph continuous or discrete? Why?
- Imagine the exact population of the United States at each instant of time. While it may seem obvious that there should be such an exact population (whether it can be measured or not), one can argue that no such thing exists. Is there an exact instant that an individual is born or dies? Is there an exact instant that an immigrant enters the country or an emigrant leaves? Discuss these questions with one or two classmates, and write a paragraph summarizing the discussion.
- “Time is just Nature's way of keeping everything from happening all at once.” Explain how this statement is related to the concept of function of time.
This quotation has been attributed to Woody Allen, John Wheeler, Albert Einstein, and Anonymous. Take your pick.)
