1.5 The Algebra of Functions
Checkpoint 1
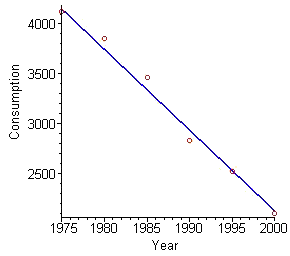
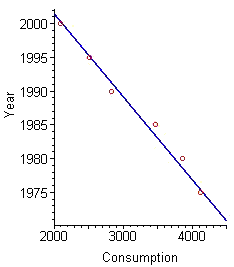
In Activity 1 of Section 1.2, you found that the data points in Table C1 were fit reasonably well by the equation `y=-81.24 t+164,600`, whose graph is shown with the data points in Figure C1.
Per Capita Cigarette Consumption
Table C1 |
Figure C1 |
Figure C2 |
Year |
Consumption |
1975 |
4,123 |
1980 |
3,851 |
1985 |
3,461 |
1990 |
2,827 |
1995 |
2,515 |
2000 |
2,092 |
|
| 
|
- What is the slope of this linear function? (Note that the scales on the graph are not equal.)
- What is the slope of the inverse function (shown in Figure C2)?
- How are these two slopes related?