 |
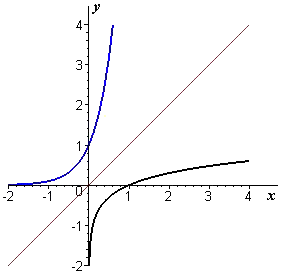
| Figure C5 Exponentiation and logarithm base 10 |
In Figure C5 we show graphs of `y=10^x` and `y=log_10x`. What do you observe about these graphs? How do your observations relate to our earlier discussion of graphical representations of inverse functions?