Chapter 2
Models of Growth: Rates of Change
 2.1
Rates of Change
Exercises
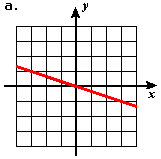
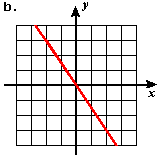
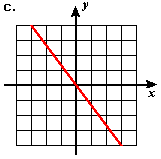
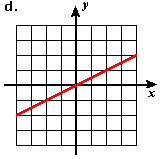
- Estimate the slope of each of the following lines.
In Exercises 2-11, find an equation of the given line in the `x`,`y`-plane:
- The line with slope `1.5` through the point `text[(]-1, 2.3text[)]`.
-
The line through the points `text[(]2.1, 1.7text[)]` and `text[(]-1.5, 4.2text[)]`.
-
The line with slope `1text(/)2` through the point `text[(]5, -2text[)]`.
-
The line through the points `text[(]3, -7text[)]` and `text[(]1, -3text[)]`.
-
The line with slope `-1.7` through the point `text[(]1.5, -3.2text[)]`.
-
The line through the points `text[(]1.3, -0.7text[)]` and `text[(]1.5, -3.2text[)]`.
- The line through the point `text[(]12,14text[)]` that is parallel to the `x`-axis.
- The line through the point `text[(]5,4text[)]` that is parallel to the line `4x+5y=3.`
- The line through the point `text[(]5,4text[)]` that is parallel to the line through the points `text[(]-1,6text[)]` and `text[(]5,5text[)]`.
- The line through the point `text[(]-9,11text[)]` that is parallel to the line `2x-5y+7=0`.
-

Our pop-up calculator (click on image at right) operates in radian mode. Find the average rate of change of the sine function (use the

button) over each of the following intervals.
| a. `[0,pitext(/)4]` |
b. `[0,pitext(/)2]` |
c. `[0,pi]` |
d. `[pitext(/)2,pi]` |
- Find the average rate of change of the cosine function (see Exercise 12 — use the
 button) over each of the following intervals.
| a. `[0,pitext(/)4]` |
b. `[0,pitext(/)2]` |
c. `[0,pi]` |
d. `[pitext(/)2,pi]` |


 Contents for Chapter 2
 2.1
Rates of Change


 button) over each of the following intervals.
 button) over each of the following intervals.
