Chapter 2
Models of Growth: Rates of Change
2.2 The Derivative: Instantaneous Rates of Change
Problems
You will need graph paper for the first several problems. You can click on the image at the right to get a page from which you can print your own.
In Problems 1-3, `ftext[(]t text[)]` is the reciprocal function, `ftext[(]t text[)]=1/t`.
-
Sketch the graph of `ftext[(]t text[)]`. Check your graph with your graphing tool (computer or calculator).
-
Let `gtext[(]t text[)]` be the difference quotient function for a difference of `Delta t=0.001`:
`gtext[(]t text[)]=(ftext[(]t+0.001text[)]-ftext[(]t text[)])/0.001`.
- Carefully select 8 values of `t`, and calculate the corresponding values of `gtext[(]t text[)]`. (Your careful selection should enable you to sketch the graph of `g`.)
- Sketch the graph of `gtext[(]t text[)]`. Check your graph with your graphing tool.
- Describe the graph of `gtext[(]t text[)]` in words. For example, you might say how it compares with the graph of `ftext[(]t text[)]`.
- Graph the derivative of `ftext[(]t text[)]`. How does it compare with the function `g` in Problem 2?
In Problems 4-6, `ftext[(]t text[)]` is the cubing function, `ftext[(]t text[)]=t^3`.
-
Sketch the graph of `ftext[(]t text[)]`. Check your graph with your graphing tool (computer or calculator).
-
Let `gtext[(]t text[)]` be the difference quotient function for a difference of `Delta t=0.001`:
`gtext[(]t text[)]=(ftext[(]t+0.001text[)]-ftext[(]t text[)])/0.001`.
- Carefully select 8 values of `t`, and calculate the corresponding values of `gtext[(]t text[)]`. (Your careful selection should enable you to sketch the graph of `g`.)
- Sketch the graph of `gtext[(]t text[)]`. Check your graph with your graphing tool.
- Describe the graph of `gtext[(]t text[)]` in words.
- Graph the derivative of the function `ftext[(]t text[)]=t^3`. How does it compare with the function `g` in Problem 5?
-
Explain why the derivative of `s=3t^2+5` should be `6t`. (See Activity 4.)
-
 Suppose gasoline sells for `\$`2.79 a gallon in June and for `\$`3.01 a gallon in July. What can you say about the average price of a gallon of gasoline during those 2 months?
Adapted from Calculus Problems for a New Century, edited by Robert Fraga, MAA Notes Number 28, 1993. - (See Exercise 17 in Section 1.3.)
-
 What is the rate of change of temperature in degrees Fahrenheit with respect to temperature in degrees Celsius?
 -
What is the rate of change of temperature in degrees Celsius with respect to temperature in degrees Fahrenheit?
-
What relationship do you observe between these two rates?
-
-
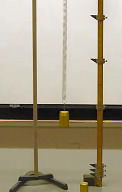 According to Hooke's Law, the force (weight) required to stretch a spring beyond its natural length (but within its elastic limit) is proportional to the distance stretched.
(Click on the image at the right to see a demonstration by Brian Andersson, School of Physics and Astronomy, University of Minnesota. Used by permission.)
According to Hooke's Law, the force (weight) required to stretch a spring beyond its natural length (but within its elastic limit) is proportional to the distance stretched.
(Click on the image at the right to see a demonstration by Brian Andersson, School of Physics and Astronomy, University of Minnesota. Used by permission.) - Express by a simple formula the force as a function of the distance stretched if a weight of 10 grams stretches a spring 1 centimeter.
- For arbitrary weights hung from the same spring (within the elastic limit), what is the rate of change of weight with respect to displacement?
- What is the rate of change of displacement with respect to weight?
- What relationship do you observe between these two rates?
- Figure E1 shows successive zoom-ins on the graph of `ftext[(]t text[)]=text[|]t text[|]` in the vicinity of the point `text[(]0,0text[)]`.
Figure E1 Three views of the absolute value function 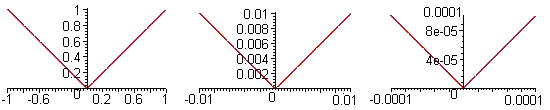
- Is this function locally linear at that point? Why or why not?
- What is the average slope of the graph from `-Delta t` to `Delta t` for a small value of `Delta t`?
- Can you use such an average slope to estimate the rate of change at `t=0`? Why or why not?
- What is the average slope of the graph from `0` to `Delta t` for a small value of `Delta t`? From `-Delta t` to `0`?
- What do you conclude about instantaneous rate of change at `t=0`?
-
Adapt your computer algebra tool or use the zooming feature on your calculator to zoom in on the graph of `ftext[(]t text[)]=|t^3|` in the vicinity of `text[(]0,0text[)]`.


- Is this function locally linear at that point? Why or why not?
- What is the average slope of the graph from `-Delta t` to `Delta t` for a small value of `Delta t`?
- Can you use such an average slope to estimate the rate of change at `t=0`? Why or why not?
- What is the average slope of the graph from `0` to `Delta t` for a small value of `Delta t`? From `-Delta t` to `0`?
- What do you conclude about instantaneous rate of change at `t=0`?
-
Adapt your computer algebra tool or use the zooming feature on your calculator to zoom in on the graph of `ftext[(]t text[)]=|t|^(3//2)` in the vicinity of `text[(]0,0text[)]`.- Is this function locally linear at that point? Why or why not?
- What is the average slope of the graph from `-Delta t` to `Delta t` for a small value of `Delta t`?
- Can you use such an average slope to estimate the rate of change at `t=0`? Why or why not?
- What is the average slope of the graph from `0` to `Delta t` for a small value of `Delta t`? From `-Delta t` to `0`?
- What do you conclude about instantaneous rate of change at `t=0`?
Adapt your computer algebra tool or use the zooming feature on your calculator to zoom in on the graph of `ftext[(]t text[)]=|t|^(2//3)` in the vicinity of `text[(]0,0text[)]`.- Is this function locally linear at that point? Why or why not?
- What is the average slope of the graph from `-Delta t` to `Delta t` for a small value of `Delta t`?
- Can you use such an average slope to estimate the rate of change at `t=0`? Why or why not?
- What is the average slope of the graph from `0` to `Delta t` for a small value of `Delta t`? From `-Delta t` to `0`?
- What do you conclude about instantaneous rate of change at `t=0`?