Chapter 2
Models of Growth: Rates of Change
2.6 Logarithms and Representation of Data
2.6.4 Finding a Power Model
In the following example we show how to find a model function for data that appear to fit a power model.
Example
 The Jurassic Toy Company produces seven models of their stuffed brachiosaurus. Each of the newer six models scales up the original successful model. Table 4 gives, for each model, the volume `v` of compressed stuffing required (in cubic inches) together with the scale factor `xtext(.)` Find a model formula for `v` as a function of `xtext(.)`
x |
1 |
2 |
3 |
4 |
5 |
6 |
7 |
v |
2.4 |
19.1 |
64.0 |
152 |
295 |
510 |
813 |
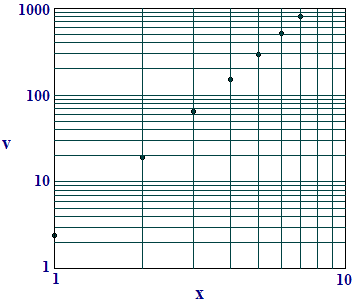
Solution To check whether a power model is reasonable, we look at a log-log plot of the data and decide whether the plotted points lie close to a straight line. Figure 4 shows the plot for these data.

Now how do we find an appropriate model of the form
If we have such a model, then
Thus the straight line in the log-log plot should have slope `r text(.)` If we use the first and last points to determine the slope, then our choice of `r` should be
It looks like `3` is a reasonable power.
Now our model has the form . If we use, say, the fourth point to determine `c text(,)` we have
or
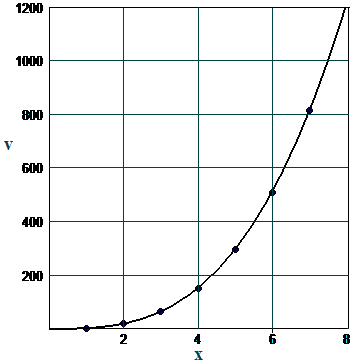
Our model function is
We show a plot of the data with the graph of this model function in Figure 5.

Image credit


