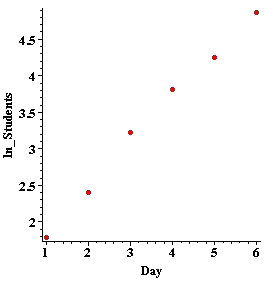
We plot the natural logarithm of the number of students aware against the number of the day and and check to see that the data points lie approximately on a straight line. Figure A1 shows the plot.

Figure A1 Log of number of students
aware as a function of time