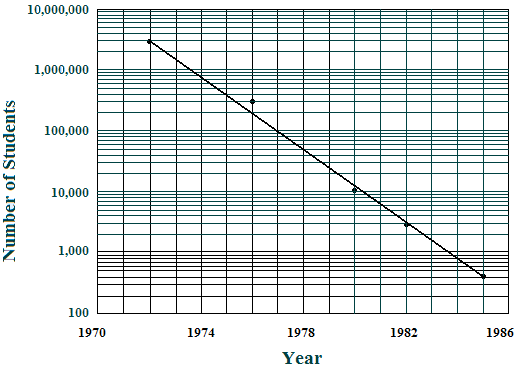
Figure C1 The Math Pipeline
We repeat the Math Pipeline Graph in Figure C1.

Identify the horizontal lines in the Math Pipeline Graph that represent `700 text(;)` `20text(,)000 text(;)` `400text(,)000 text(;)` and `5text(,)000text(,)000 text(.)`
For each of the five data points, estimate the number of students directly from the graph.