Chapter 4
Differential Calculus and Its Uses
 4.2
Second Derivatives and Graphs
Exercises
- For each of the following functions:
- Calculate the second derivative,
- Identify the range of values of `t` for which the graph is concave up and the range of values for which the graph is concave down.
- `ftext[(]t text[)]=e^(4t)`
- `gtext[(]t text[)]=e^(-3t)`
- `htext[(]t text[)]=3^t-t^3`
- `utext[(]t text[)]=t+1`
- `vtext[(]t text[)]=t^3+t^2+t+1`
- `wtext[(]t text[)]=t^2+t+1`
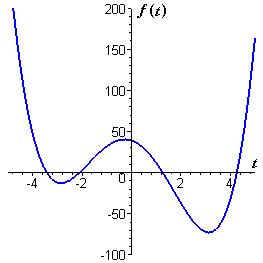
- Figure E1 shows a graph of the polynomial function `ftext[(]t text[)]=t^4-18t^2-10t+39`.
- Approximately where is `ftext[(]t text[)]=0`?
- Approximately where is `f'text[(]t text[)]=0`? Click on the graph to get a printable copy, and mark these points on your copy.
- On what intervals is `f'` positive?
- On what intervals is `f'` negative?
-
- For the function graphed in Figure E1, approximately where is `f''text[(]t text[)]=0`?
- On what intervals is `f''text[(]t text[)]` positive?
- On what intervals is `f''text[(]t text[)]` negative?
-
- Find the zeros of the function `f` defined by the formula `ftext[(]t text[)]=t^3-36t`.
- Calculate `f'`, and find the zeros of `f'`.
- Calculate `f''`,and find the value of `f''` at each zero of `f'`.
- For each zero of `f'`, decide whether the corresponding point on the graph is a local maximum, a local minimum, or neither.
- Decide whether the zero of `f''` represents an inflection point.
-
The graphs of three functions appear in Figure E2. Identify which is the graph of `f`, which is the graph of `f'`, and which is the graph of `f''`.
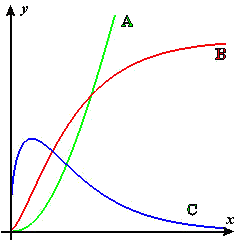
Figure E2 Identify the function f and its first two derivatives
- Figure E3 shows the graph of the derivative `f'text[(]x text[)]` of an unknown function `ftext[(]x text[)]`.
- From the figures A–F following, choose the one that shows the graph of `ftext[(]x text[)]`.
- From the figures A–F following, choose the one that shows the graph of `f''text[(]x text[)]`.
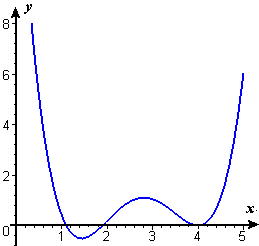
Figure E3 Graph of f '(x)A. 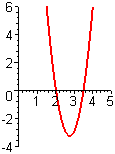
B. 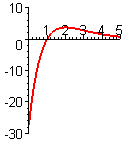
C. 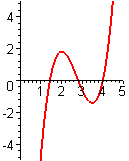
D. 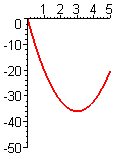
E. 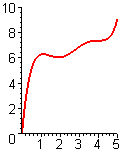
F. 