Chapter 4
Differential Calculus and Its Uses
4.2 Second Derivatives and Graphs
Problems
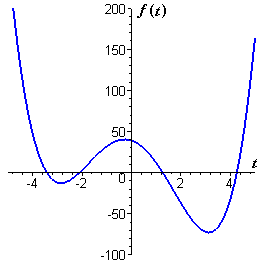
- Figure P1 shows a graph of the polynomial function `ftext[(]t text[)]=t^4-18t^2-10t+39`.
- Approximately where is `ftext[(]t text[)]=0`?
- Approximately where is `f'text[(]t text[)]=0`? Click on the graph to get a printable copy, and mark these points on your copy.
- On what intervals is `f'` positive?
- On what intervals is `f'` negative?
- Sketch a graph of `f'`.
- Confirm your results in parts (b) through (e) by calculating `f'` and graphing it with your graphing tool.
-
- For the function graphed in Figure P1, approximately where is `f''text[(]t text[)]=0`?
- On your printed copy of the graph, mark the points where `f''text[(]t text[)]=0`.
- On what intervals is `f''text[(]t text[)]` positive?
- On what intervals is `f''text[(]t text[)]` negative?
- Sketch a graph of `f''text[(]t text[)]`.
- Confirm your results in parts (a) through (e) by calculating `f''` and graphing it with your graphing tool.
-
- Find the zeros of the function `f` defined by the formula `ftext[(]t text[)]=t^3-36t`.
- Calculate `f'`, and find the zeros of `f'`.
- Calculate `f''`,and find the value of `f''` at each zero of `f'`.
- For each zero of `f'`, decide whether the corresponding point on the graph is a local maximum, a local minimum, or neither.
- Decide whether the zero of `f''` represents an inflection point.
- Sketch a graph of `f`. After making your own graph, you can check your work with your graphing tool.
-
The graphs of three functions appear in Figure P2. Identify which is the graph of `f`, which is the graph of `f'`, and which is the graph of `f''`.
Explain your conclusions.
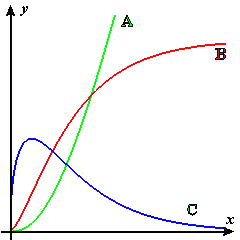
Figure P2 Identify the function f and its first two derivatives
-
Imagine the graph of a polynomial of degree 3 or higher. Imagine that this graph is a map of a relatively flat road. Imagine that you are riding a bicycle along this road in the positive `x`-direction.
- Describe what you experience as you pass through a point at which the second derivative of the polynomial is zero.
- What are you doing along a stretch of the road on which the second derivative is positive?
- What are you doing along a stretch of the road on which the second derivative is negative?
-
Sketch the graph of a function that is
- increasing at an increasing rate.
- increasing at a decreasing rate.
- decreasing at an increasing rate.
- decreasing at a decreasing rate.
- Figure P3 shows the graph of the derivative `f'text[(]x text[)]` of an unknown function `ftext[(]x text[)]`.
- From the figures A–F following, choose the one that shows the graph of `ftext[(]x text[)]`.
- From the figures A–F following, choose the one that shows the graph of `f''text[(]x text[)]`.
- Justify each of your choices in parts (a) and (b).
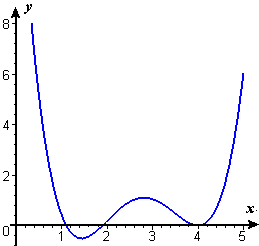
Figure P3 Graph of f '(x)A. 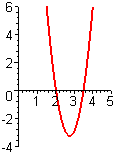
B. 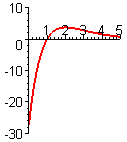
C. 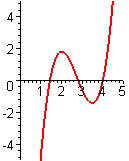
D. 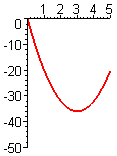
E. 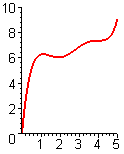
F. 