 |
 |
|
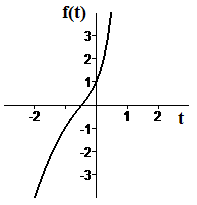
| Figure A1 Graph
of `ftext[(]t text[)]=e^(3t)-t^2` |
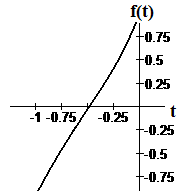
Figure A2 First zoom-in |
The numbers you see and the calculator keys or CAS functions you use may be different. We show a first graph of `f` and a zoom-in graph in Figures A1 and A2.
 |
 |
|
| Figure A1 Graph
of `ftext[(]t text[)]=e^(3t)-t^2` |
Figure A2 First zoom-in |
We use our trace or digitizing tool to see how close we can get to the root,
and we find that `ftext[(]-0.489text[)]=-0.009`. We see from the negative function value that `- 0.489` is just to the left of the root, so we may take `- 0.489` as our value for `b`. When we move just a little to the right, we find `ftext[(]-0.479text[)]=0.008`, which is positive. Thus `- 0.479` is to the right of the root, and we may use this value for `c`. Note that `c-b=0.01`. Now we use the Root key or Solve function, with lower bound `b`, upper bound `c`, and guess `c`. The calculator or computer tells us that the root is approximately `- 0.4839075718` and the value of `f` at that input is `-1*10^(-14)`.