 with
with
Maple Tool 1
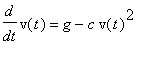
This worksheet illustrates the process described in Section 5.2 for obtaining an approximate solution of the initial value problem
with
![]() .
.
| > | with(plots):with(DEtools): |
For drops of diameter 0.05 inches or approximately 0.004 feet, the value of
![]() is.
is.
| > |
| > | c:=0.115; |
We enter a value for
![]() in feet per second squared:
in feet per second squared:
| > | g:=32.2; |
We consider the velocity of the drop for the first two seconds. The time step
![]() is determined by the number of divisions
is determined by the number of divisions
![]() of the 2-second time interval.
of the 2-second time interval.
| > | Delta:=2/n; |
| > | t:=k->k*Delta; |
We plot the approximate solution together with the slope field for the differential equation.
| > | DE:=diff(v(t),t)=g-c*v(t)^2; sfield:=dfieldplot(DE,[v(t)], t=0..2, v=0..25):%; |
We do the first two steps in the approximation individually.
| > | n:=10; v[0]:=0; v[1]:=(g-c*v[0]^2)*Delta; |
| > | v[2]:=v[1]+(g-c*v[1]^2)*Delta; |
Now we calculate the all the steps.
| > | n:=10; Delta:=2/n; v := proc(k) |
| > | v(k) := v(k-1)+(g-c*v(k-1)^2)*Delta; |
| > | end: |
| > | v(0):= 0: |
Check the values for
![]() and
and
![]() .
.
| > | v(1); v(2); |
Plot the approximate solution for n steps.
| > | solution:=[seq([t(k),v(k)],k=0..n)]: solPlot := plot(solution, t=0..2, v=0..25, style=POINT,symbol=circle, color=blue, thickness=2): %; |
We compare this approximate solution with the slope field.
| > | display(sfield,solPlot); |
We also compare the approximate solution to the symbolic solution stated in Section 5.1.
| > | V:=t->sqrt(g/c)*(1-exp(-2*sqrt(g*c)*t))/(1+exp(-2*sqrt(g*c)*t)); |
Start with
![]() and then double the number
and then double the number
![]() of calculation steps. (The following block of commands repeats all the essentials from above.)
of calculation steps. (The following block of commands repeats all the essentials from above.)
| > | n:=10; Delta:=2/n; v := proc(k) |
| > | v(k) := v(k-1)+(g-c*v(k-1)^2)*Delta; |
| > | end: |
| > | v(0):= 0: solution:=[seq([t(k),v(k)],k=0..n)]: solPlot := plot(solution, t=0..2, v=0..25, style=POINT,symbol=circle, color=blue): |
| > | Vplot:=plot(V(t),t=0..2, color=green,thickness=2): display(Vplot, solPlot); |
Go back to the most recent definition of n , and double twice more, comparing the symbolic and numerical solutions each time you double the number of calculation steps.
| > |