 |
 |
|
Figure A1 Numerical solution
for position x(t) of the mass bouncing on the spring |
Figure A2 Numerical solution
for velocity v(t) of the mass bouncing on the spring |
We repeat Figures 4 and 5 from 5.4.2 as Figures A1 and A2.
 |
 |
|
Figure A1 Numerical solution
for position x(t) of the mass bouncing on the spring |
Figure A2 Numerical solution
for velocity v(t) of the mass bouncing on the spring |
The position curve in Figure 4 (A1) starts, as it should, one unit away from equilibrium position and oscillates between that position and one unit away in the opposite direction. The velocity curve in Figure 5 (A2) starts at zero, as it should, and has a similar oscillation. In fact, the velocity appears to be `0` whenever the position is `1` or `-1`, which is where the moving mass changes directions. And the velocity appears to be `1` or `-1` wherever `x` is `0.` That is, the fastest speeds occur where the moving mass is passing its equilibrium position.
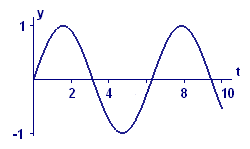
For comparison we recall the graphs of `y=costext[(]t text[)]` and `y=sintext[(]t text[)]` — we see that Figures A1 and A2 look a lot like graphs of `x=costext[(]t text[)]` and its derivative, `x'=-sintext[(]t text[).]` And that pair of functions clearly solves the initial value problem.
 |
 |
|
Figure A3 Graph of y = cos(t) |
Figure A4 Graph of y = sin(t) |