We rewrote the quotient as a product.
We applied the Product Rule.
We applied the Power Rule (with Chain Rule factor) in the first term and the Exponential Rule (with Chain Rule factor) in the second term.
We completed the calculation of the first term by using the Cosine Rule with Chain Rule factor.
We simplified the result by factoring out common factors of numerator and denominator. (There are many correct simplifications of this expression.)
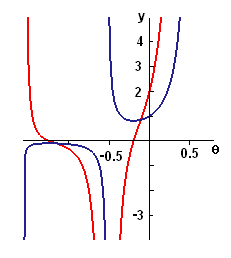
 In the figure at the left, the graph of the function is plotted in blue and that of the derivative in red. Both graphs have vertical asymptotes wherever `cos text[(]3 theta text[)]=0,` so the graphs have many interesting pieces. We show two pieces of each graph in the figure. Note the correspondence of positive, negative, and zero values of the derivative with increasing, decreasing, and relative extreme points on the graph of the original function.