Chapter 9
Probability and Integration
9.3 Continuous Probability
9.3.4 Standardized Data and the
Standard Normal Distribution
If a data set is distributed normally with mean `m` and standard deviation `sd`, then we can scale the data to obtain a new data set that is normally distributed with mean `0` and standard deviation `1`.
Activity 4
Suppose `m` is the mean and `sd` is the standard deviation of data set with values `v_1, v_2, ..., v_n`.
-
Show that the numbers `v_1 - m, v_2 - m, ..., v_n - m` form a data set with mean `0`.
Show that the numbers
`(v_1 - m)/(sd), (v_2 - m)/(sd), ..., (v_n - m)/(sd)`
form a set with mean `0` and standard deviation `1`.

This process of scaling the data to obtain a new data set with mean `0` and standard deviation `1` is called "standardizing."
| Definition For a data set `v_1, v_2, ..., v_n` with mean `m` and standard deviation `sd`, the set of standardized data values is
`(v_1 - m)/(sd), (v_2 - m)/(sd), cdots, (v_n - m)/(sd)`. |
Any data set may be standardized. If the original data set was normally distributed with mean `m` and standard deviation `sd`, then the standardized data set also will be normally distributed this time with mean `0` and standard deviation `1`.

Because we can standardize any set of normally distributed data, we'll concentrate for the moment on describing a model for data that is normally distributed with mean `0` and standard deviation `1`. The distribution for such a data set has a special name.
| Definition The normal distribution with mean `0` and standard deviation `1` is called the standard normal distribution. |
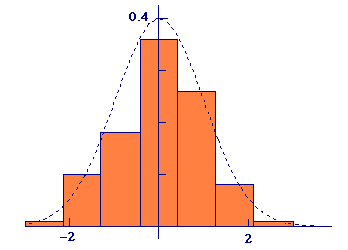
We need both a distribution function and the corresponding probability density function for the standard normal distribution. The bell shape of the histogram in Figure 2 suggests that the probability density function should have a graph that looks like Figure 3. The scale is yet to be determined, but it must be such that the total area under the curve turns out to be `1`. Our standardization places the mean at `0`, and we expect normally distributed data to peak at the mean and be symmetric with respect to the mean. The density should also be near zero for events far from the mean on either side.
 |
 |
| Figure 3 Standard normal probability density function |
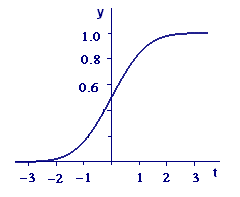
Figure 4 Standard normal distribution function |
Except for scale, your response to Activity 3(b) should look like the curve in Figure 4, and the standard normal should have a distribution with the same shape. It should start at a zero level on the left, continuously increase, and level off at `1` (`100`%) on the right. The symmetry of the density function dictates a `y`-intercept of `0.5`, since half the area under the density function must be on the left and half on the right. Furthermore, the steepest part of the distribution graph must be at the mean (`t = 0`), since the density peaks there.
Among functions that have graphs with the bell shape shown in Figure 3 are those with formulas of the form `f text[(] t text[)] = ce^(-t^2text[/]2)`. If you experiment, you will find that the scale factor `c` must be approximately `0.3989`. In fact, the graph in Figure 3 is that of `f text[(] t text[)] = 0.3989 e^(-t^2text[/]2)`, which makes a very satisfactory probability density function for the standard normal distribution.
For the standard normal probability density function `f text[(] t text[)] = ce^(-t^2text[/]2)`, explain why the distribution function must be
To illustrate the fit of the standard normal density function to a set of normally distributed data, we show in Figure 5 the result of
standardizing the height data plotted in Figure 2,
plotting a histogram of the standardized data divided by the number of data points, and
superimposing a graph of the standard normal density function.
The division step replaces the numbers of standardized data points in each interval by fractions in each interval. Note the similarity of the standardized and scaled histogram to the original one in Figure 2.
plus the standard normal probability density function