Comment on Activity 3
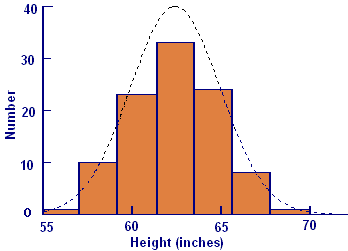
Figure A2 General shape of the density curve
Figure A2 shows a curve with the same shape as the density function superimposed on the histogram. The density function `f` is the derivative of the distribution function, and `F text[(] t text[)]` represents the probability that a random data value is less than `t`. From this we can infer the following properties of the graph of `F`.
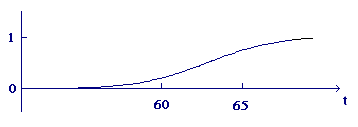
- The probability that a random data value is less than `t` drops to zero as `t rarr -oo`, so the graph of `F` must be tangent to the `t`-axis on the left
- Since `f text[(] t text[)]` is always positive, the graph of `F` must increase steadily.
- The slope of the graph at `(t,F text[(] t text[)])` is `f text[(] t text[)]`, so the slope is steepest where `f text[(] t text[)]` is largest, i.e., at the mean.
- The probability that a random data value is less than `t` rises to `1` as `t rarr oo`, so the graph must be tangent to the line `y = 1` on the right.
Figure A3 shows the graph of a function `F` with all of these properties.
Figure A3 Sketch of the normal distribution curve


