- Friday you have an exam. It will cover the four topics
- Graphs
- Algebra
- Mobius bands
- Probability
-- let's look another example of natural frequencies: given
-
- The "New Normal" refers to the normal (or bell-shaped) curve, and
then its "replacement" -- the fat-tailed distributions.
- What is this Normally Distributed Data?
- Statistics are closely related to probability, which is why they're
grouped together in our reading ("Students would be better served by learning
more about probability and statistics", p. 175), and which is why we're studying them right
after studying probability.
Our author says that, while it's true that "you'll find later in life that it's handy to know what a standard deviation is", it is "even handier to know what a distribution is."
So our objective in this unit is to understand three things, actually:
- A distribution
- Measures of central tendancy (mean, median)
- Measures of spread (standard deviation)
- Let's start with heights of NKU students:
- We collect data;
- construct a histogram, or graph of the data, grouping the data into "bins"; then
- attempt to describe the distribution of the data using
statistics. Some of the tools we use are
- A catalog of distributions
- Measures of central tendancy (mean, median)
- Measures of spread (standard deviation)
By "catalog of distributions" I mean some candidates for the model behind the data. We may discover that the data looks symmetric, for example, which would rule out a bunch of types of distributions. If the histogram of the data is bell-shaped, then perhaps it is normally distributed, which is what are author is interested in discussing here.
- Some of my favorite statistics:
- The average American has one testicle and one ovary.
- The average income for a Lakeside School (Seattle, Washington) graduate was $2.5 million. (In 1997)
How can we explain these two statistics? Let's start with that first one. Is it true that the average American has one testicle and one ovary? Think about how the average -- or mean -- is defined.
- The mean is only one measure of "central tendancy", or
measure of the middle of a data set.
Let's try a different measure of "central tendency":
The median American has no testicles and two ovaries.Mean and median try to characterize the "middle" of a distribution. Do you know how they're defined?
Why do these values of mean and median make sense? What is the distribution of testicles and ovaries?
- What is normally distributed data?
- Certainly you've rolled
dice.....
This simulation produces a variety of distributions. What are their properties?
- One die: a uniform distribution (flat, but symmetric)
- Two dice: a "tent" distribution (peak, triangular, still symmetric)
- Six (and, better yet, nine) dice: a distribution which is starting to look very normal.
- Normally distributed data is symmetric -- it's as likely to be
above the mean as below the mean.
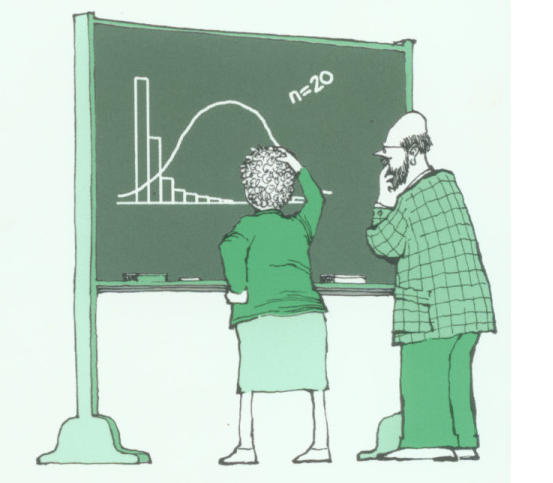
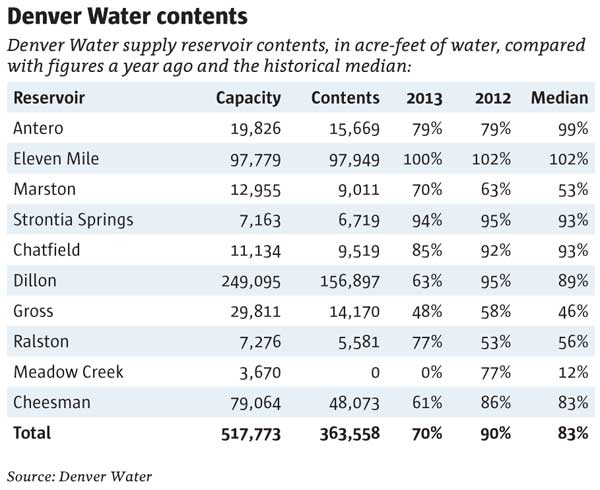
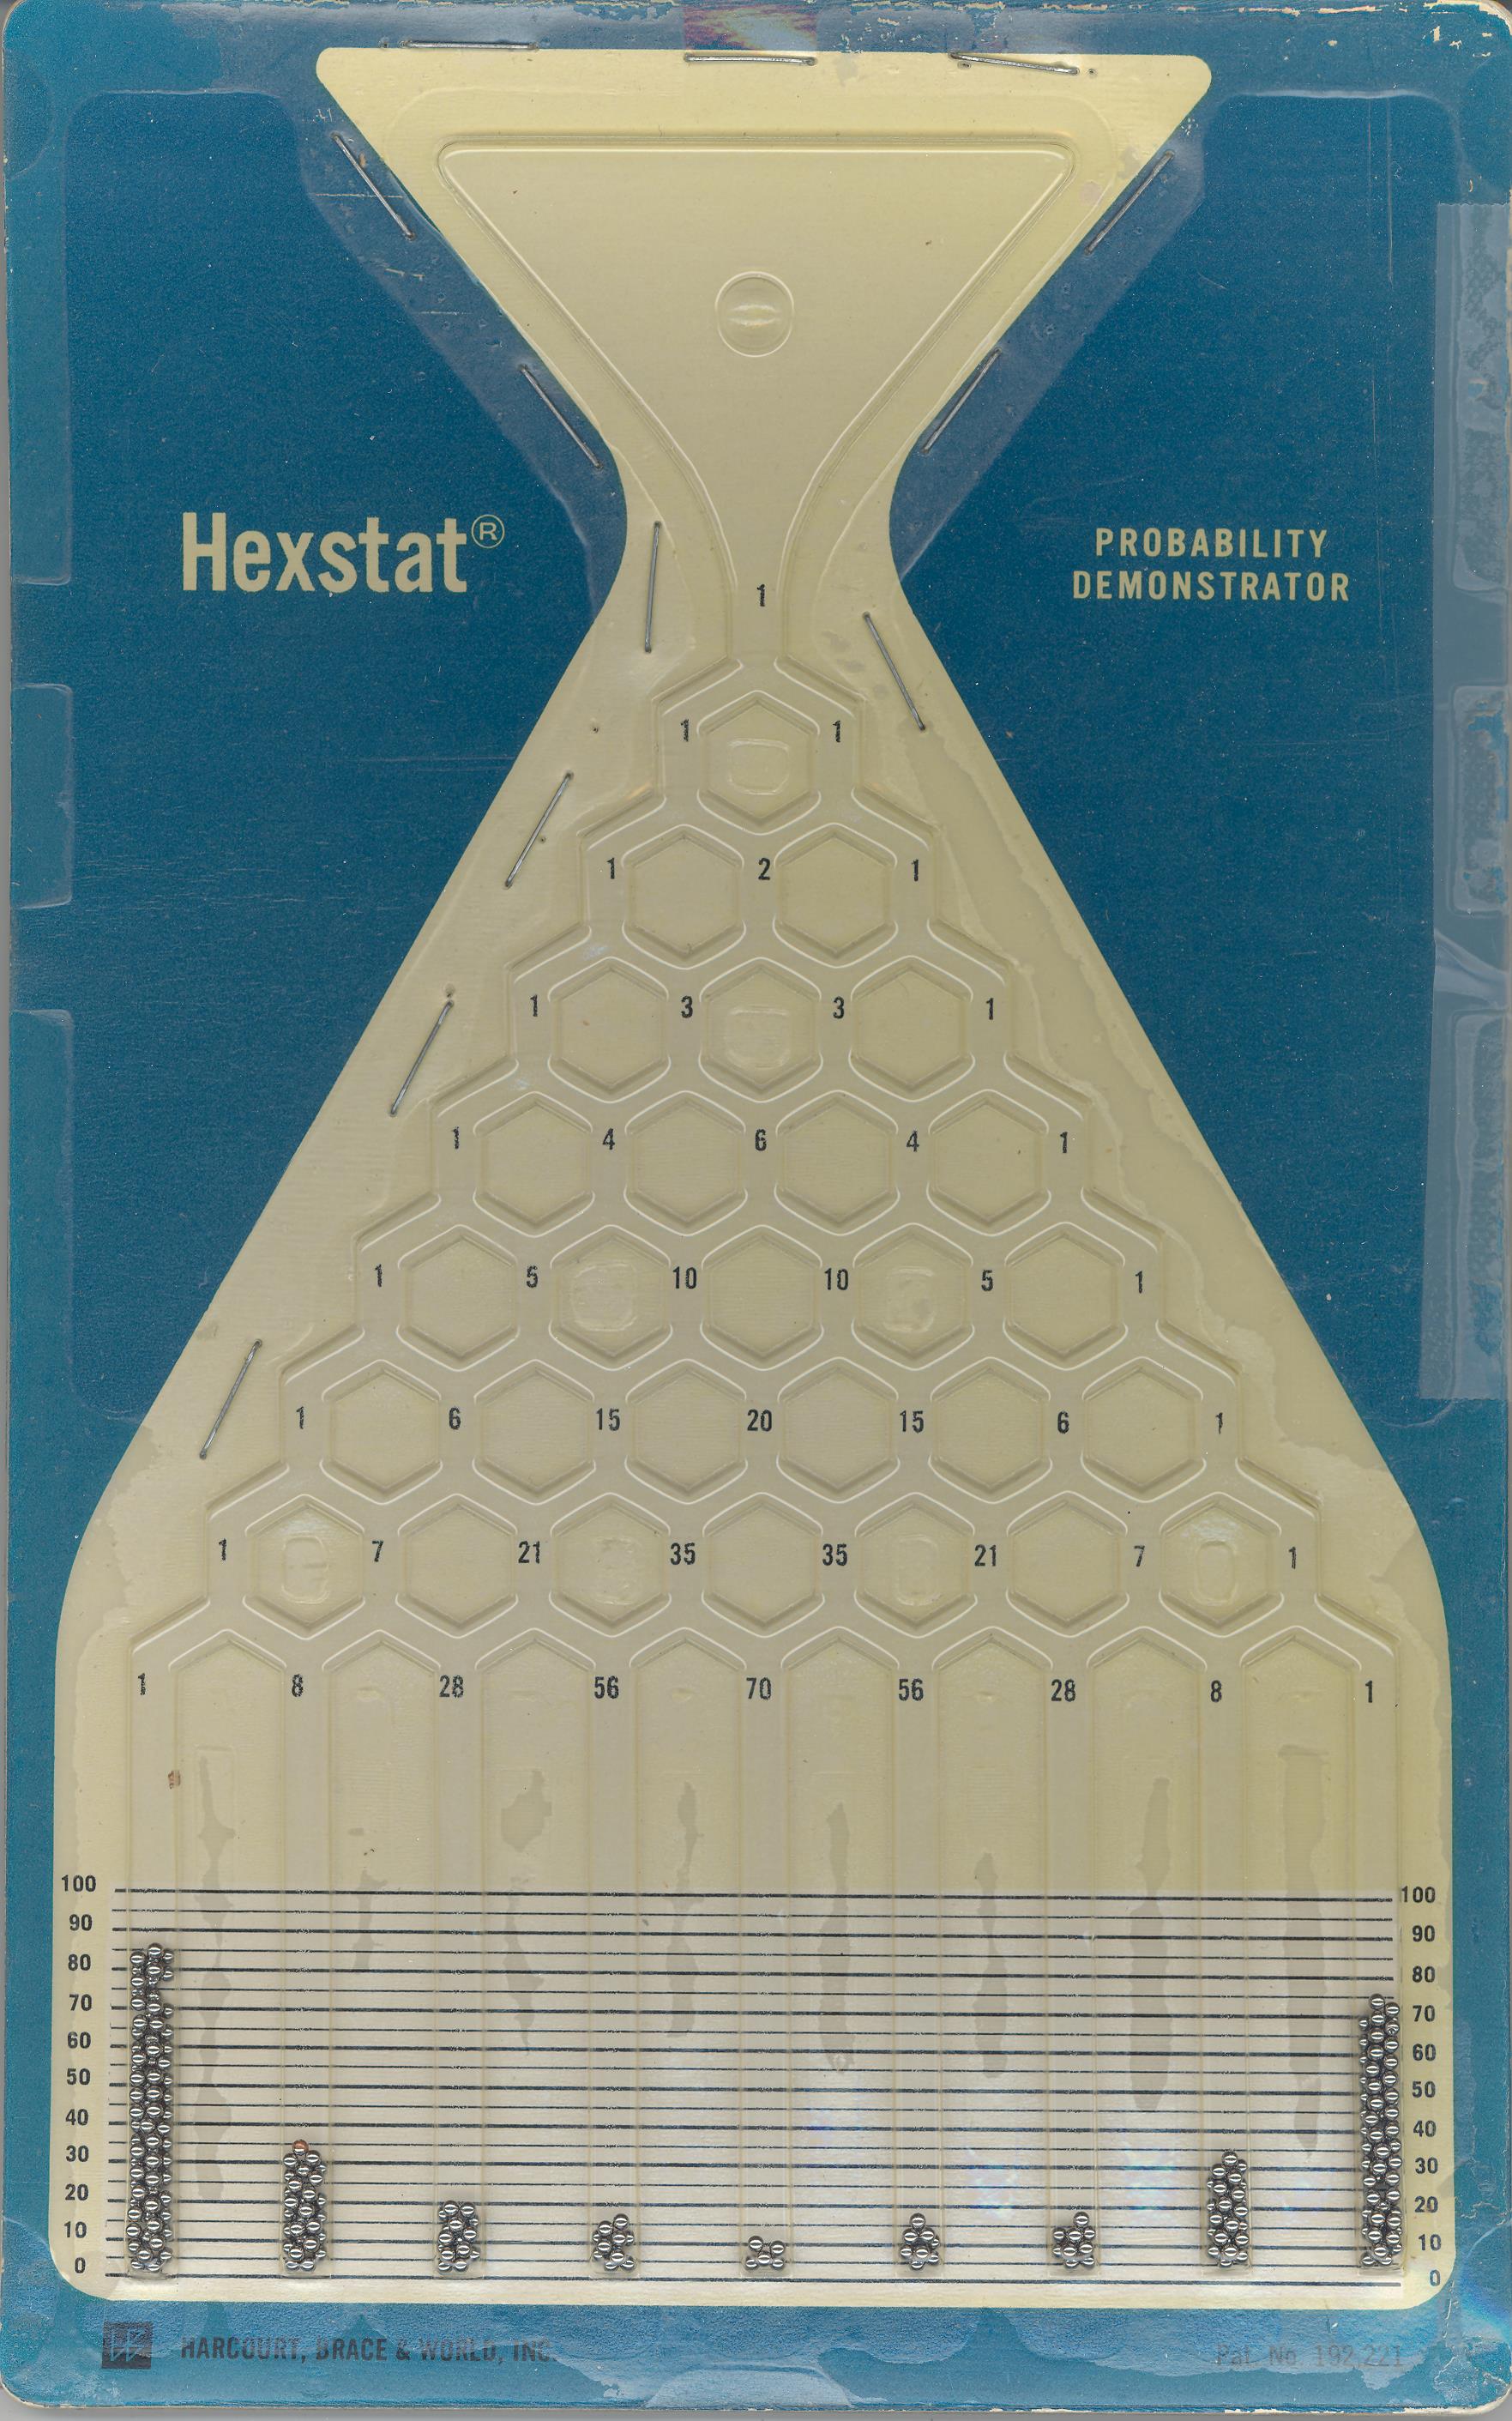
- Hexstat probability demonstrator (the "Galton board") demonstrates
the author's contention that "...the pattern is utterly
predictable: it always forms a bell-shaped distribution -- even
though it's impossible to predict where any given ball will end
up." (p. 177)
For example, check these out:
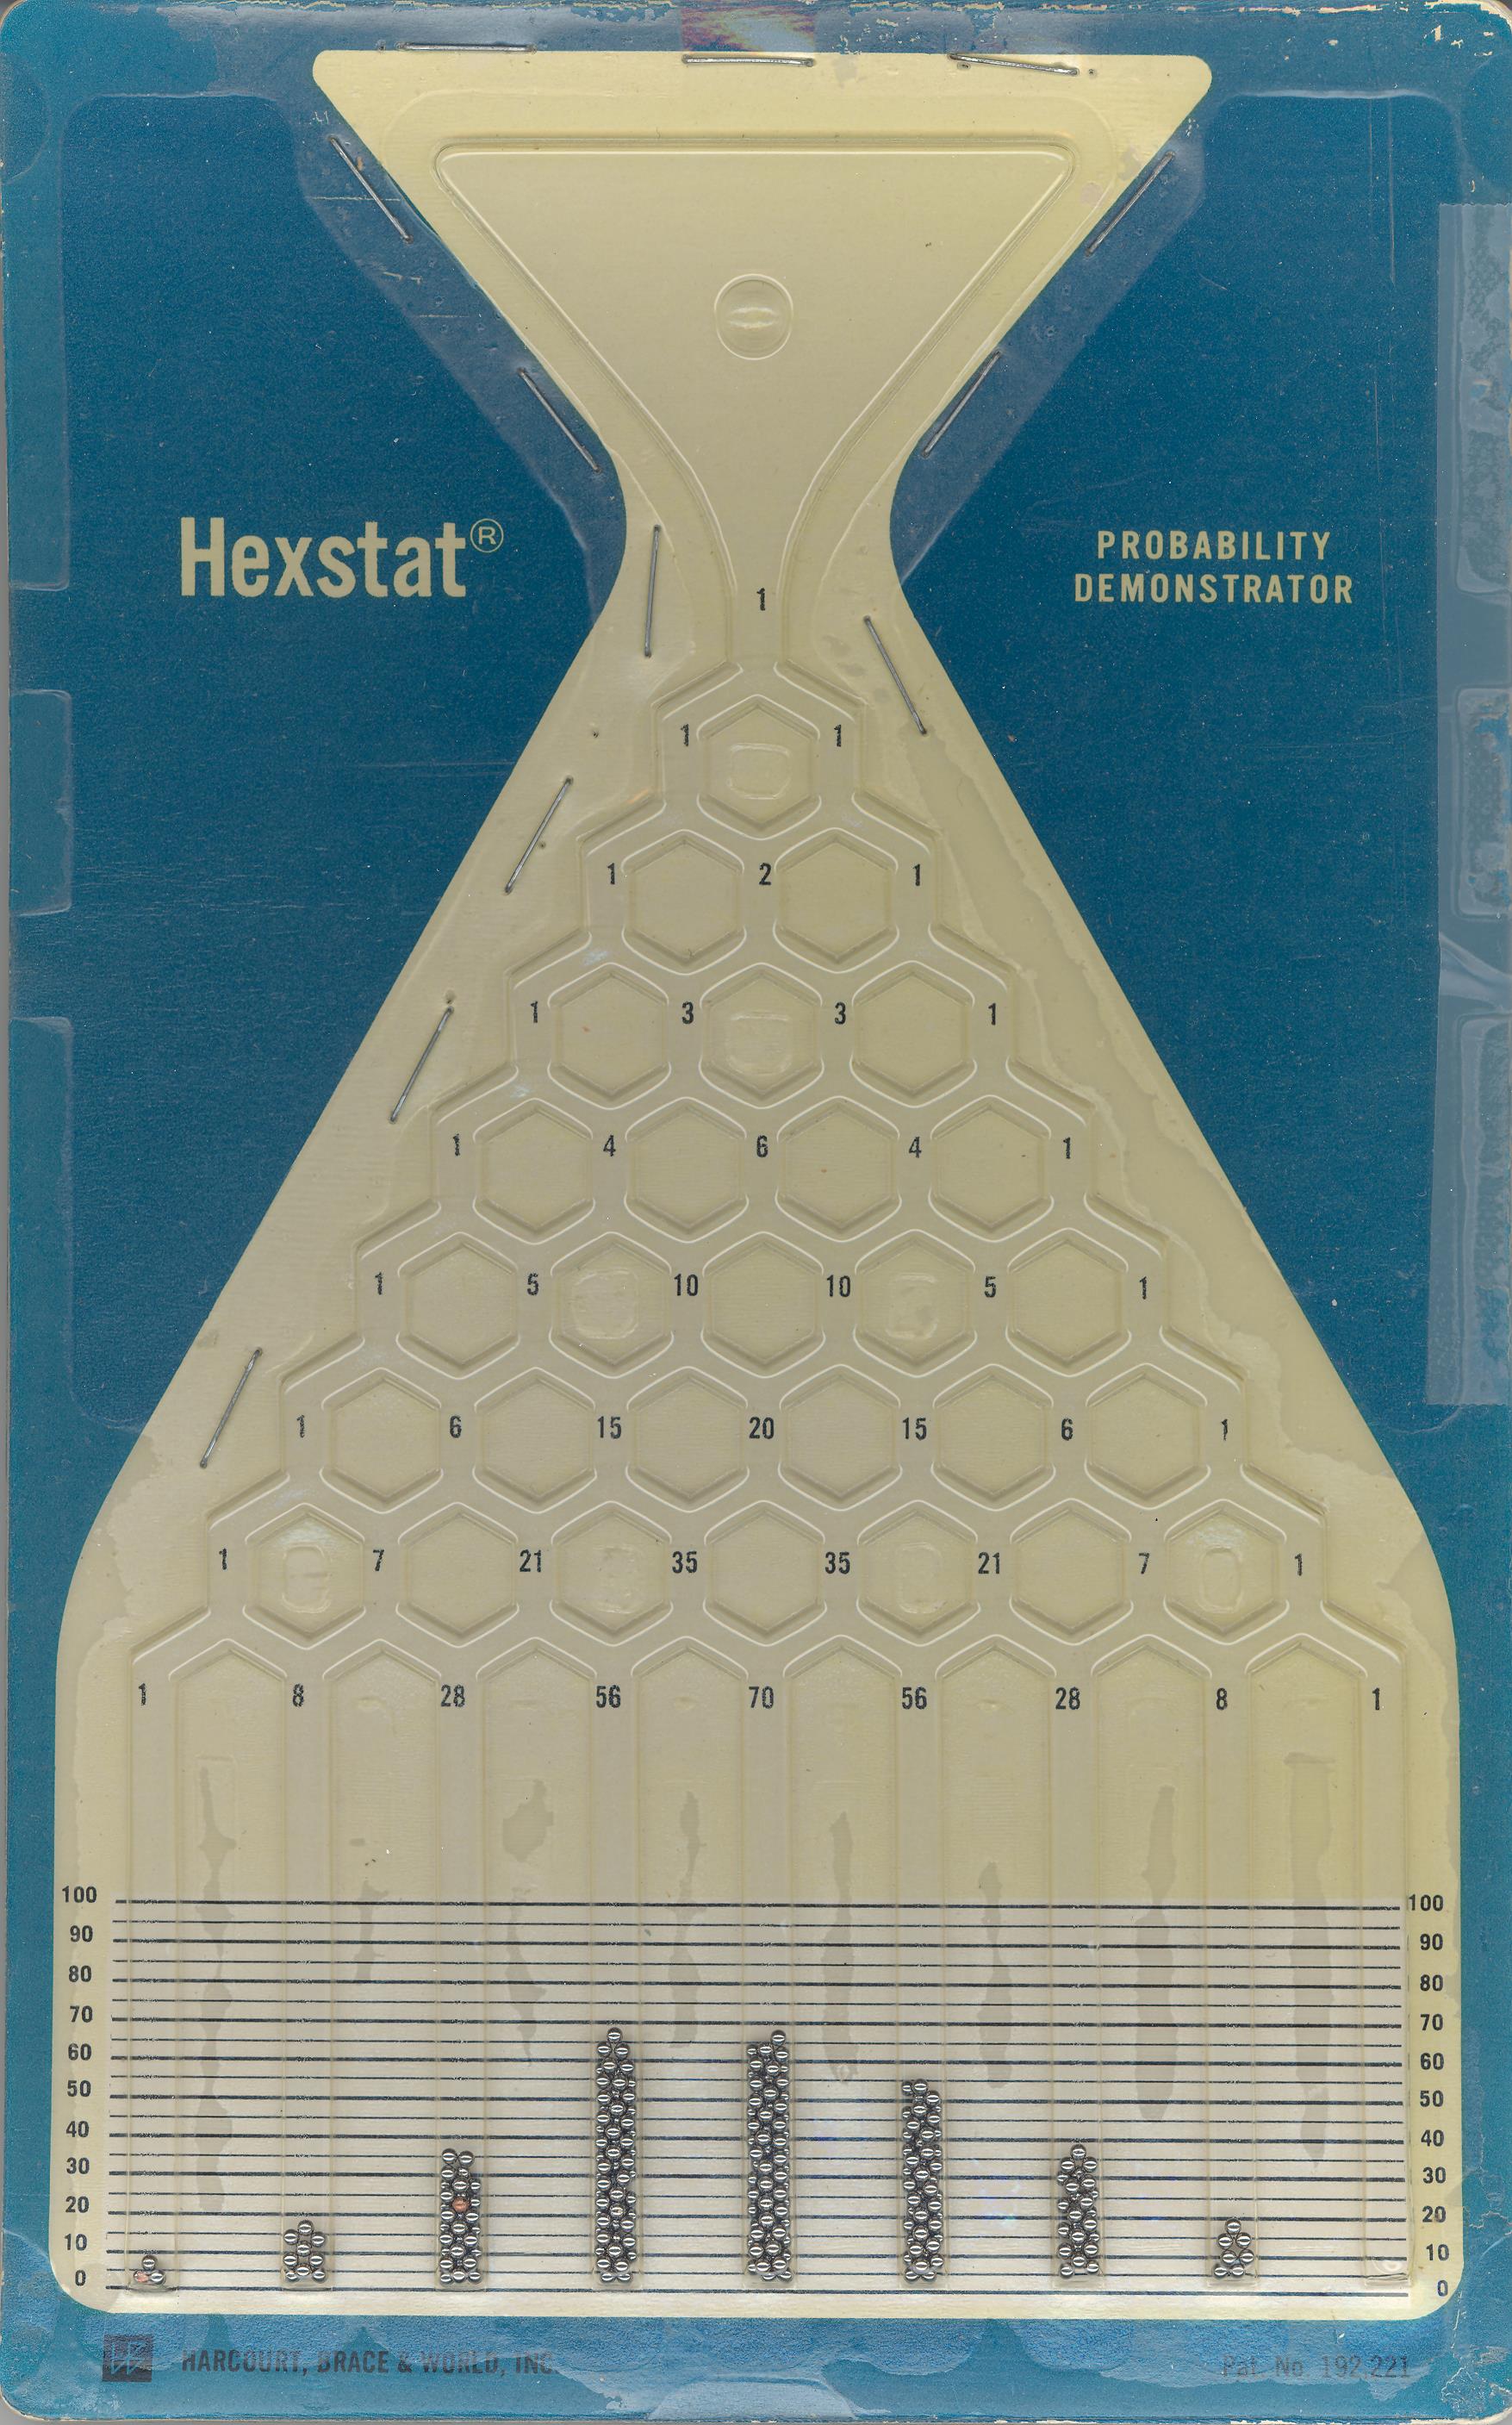
- Pascal's Triangle and the normal curve
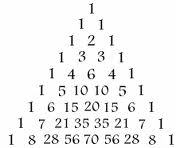
This version of Pascal's triangle goes up to the "8 row" (with nine columns); since there are nine "bins" in my Hexstat Probability Generator, the numbers in this version of Pascal's triangle are actually indicative of the probabilities of the balls ending up in any of the bins. So it's 70 times more likely that a ball will end up in the middle bin than in the end bins.
If you want the actual probabilities of each bin, you divide each values in the triangle by the total for the row (in this case,
).
- Certainly you've rolled
dice.....
- A lot of data exhibit the normal curve - but some data don't!
- Replacing a histogram by a smooth curve....
How is our mathematician doing at modeling the data?
What has she missed?
- Replacing a histogram by a smooth curve....
- The Empirical Rule (for normal data)
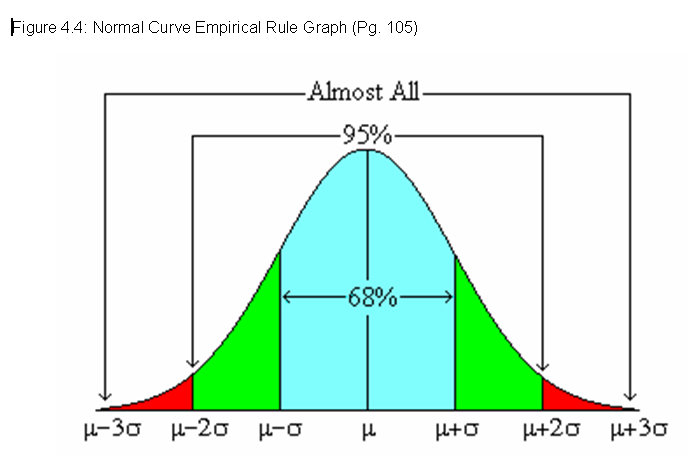
- The greek letter
represents the "standard deviation", which is reflective of the spread of the data.
A deviation is the difference between a data value and the mean value. So if the mean height is 5'10", and you're 5'8" tall, then your deviation is -2. The "standard deviation" thus is a measure of the "typical deviation".
The larger
- Percentages in categories, by using
- Practical
Example
(We can now answer a few of these questions using the empirical rule.) - Notice how we're using statistics (in this case a model distribution) to compute probabilities.
- The greek letter
- On page 178, we see that people exaggerate their heights -- this shows up as a shift in the mean, in the position of the middle of the data. Interesting use of statistics, isn't that!
- Statistics are closely related to probability, which is why they're
grouped together in our reading ("Students would be better served by learning
more about probability and statistics", p. 175), and which is why we're studying them right
after studying probability.
- Fat tails:
- Fat-tailed distributions have more data out in the tails
of the distribution than the normal distribution would
suggest. They don't follow the Empirical Rule.
Unfortunately people who know a little stats may get infatuated with the normal distribution, and apply it even where it's not appropriate.
- Examples:
- power law distribution of cities (p. 179)
- This distribution is obviously not normal: it's like the distribution in the comic above. One of the first things you might notice is that it's not symmetric.
- It's also got a lot more action in the tail than we would expect, which is our authors point.
- Tank Bus #11
- My daughter is in the early bird program at Highlands, so she takes the early bird bus from home to school.
- We've been watching the times of the bus,
and collected data on three of these cards:


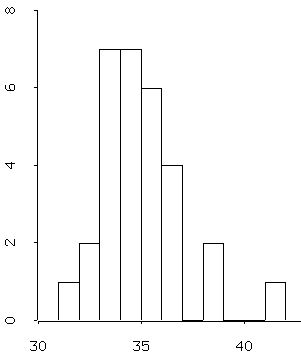
- The data:
- minutes from 6:00:
31 32 32 33 33 33 33 33 33 33 34 34 34 34 34 34 34 35 35 35 35 35 35 36 36 36 36 38 38 41 - Mean: 34.5
- Median: 34
- Standard deviation: 2
- Check out that maximum value: how many standard deviations away from the mean is it?
- If the data from this sample
reflects a normal distribution with mean 34.5 and standard
deviation of 2, then the probability of a 41 or
greater is approximately .00023, or less than 3
in 10000.
Do you believe that this data is normally distributed?
- If the bus broke down and was really late (e.g. 60), what would happen to the mean and median values? (Mean: 35.1) According to normal probability theory, the probability of this is 0. Do you believe that it's impossible? No? Fat tail!
- minutes from 6:00:
- power law distribution of cities (p. 179)
- Bush's use of the mean versus the median in a fat-tailed
distribution (p. 181) could be viewed at its most favorable as "casting something (in
this case a tax rebate) in the best light".
It and the statistic about Lakeside School are in the same category (Bill Gates and Paul Allen, founders of Microsoft, graduated from Lakeside, which tends to push up the mean), while the median remains unchanged.
In an unfavorable light, Bush's use of the mean could be construed as one of the three lies: "lies, damned lies, and statistics."
Better in both cases to use a median as the measure of central tendancy:
- Fat-tailed distributions have more data out in the tails
of the distribution than the normal distribution would
suggest. They don't follow the Empirical Rule.