- Terminology associated with polynomials
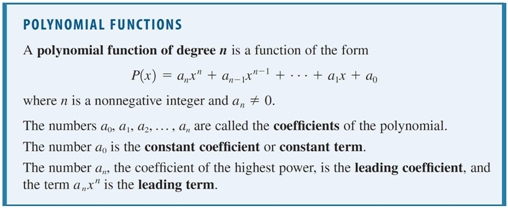
- Some of the properties of the general polynomial
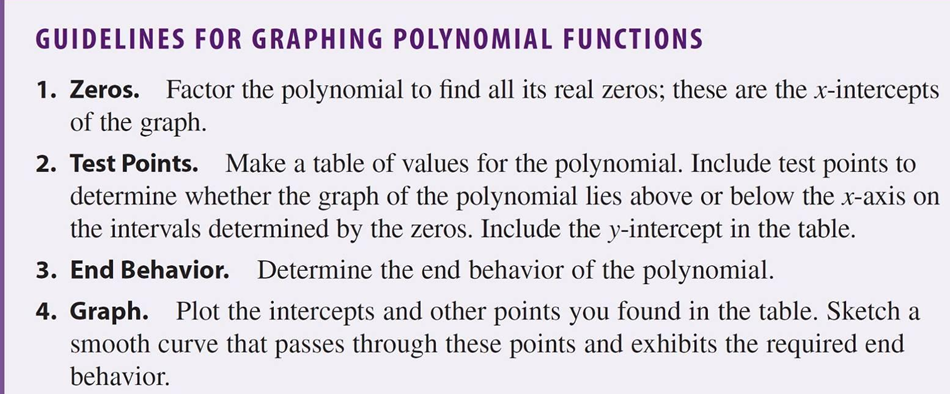
- The basics of how to graph polynomials
- First of all, they're lovely, smooth, functions defined for all real numbers.
- The very simplest polynomials are the constant functions,
e.g.
, and the linear functions, e.g.
. Both types of functions have straight line graphs.
- Next in terms of interest are the quadratics, whose graphs are parabolas. You remember those from last time. There are two kinds of parabolas: bowls and umbrellas.
- More generally, we have cubics, quartics, quintics, etc. Higher degree polynomials, and, as you may expect, the graphs get more complicated as we leading power of the variable increases.
- Definitions:
- Higher Degree polynomials
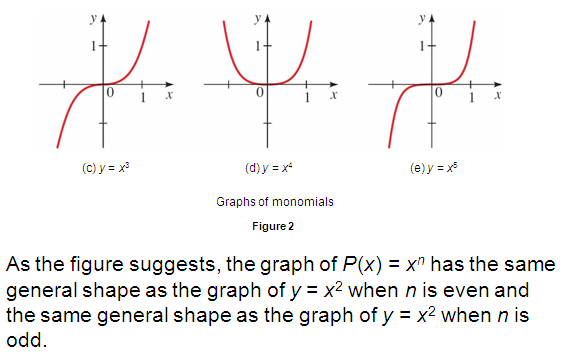
- End Behavior

Notes:
- this is the first graph that indicates that polynomials may not be symmetric.
- If you zoom far enough out, the end behavior is exactly that of the leading term. You may as well just graph the leading term.
- Real zeros (places where the polynomial function is 0)
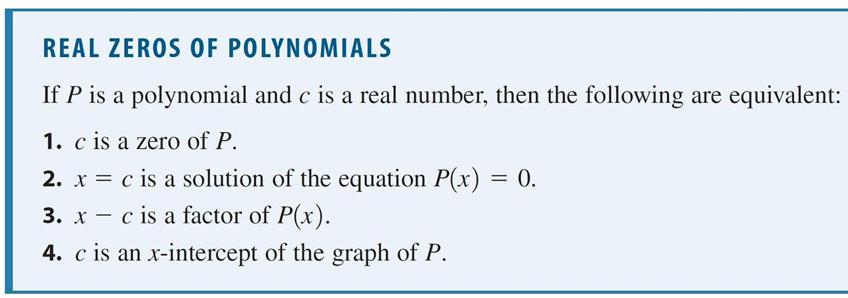
These "zeros" (x-intercepts) are generally plotted, as is the y-intercept (the point (0,p(0))).
- A change from positive to negative values of a polynomial (or vice
versa) means that there's a zero inbetween:

- Graphing Polynomials (basic course!):
- Multiplicities of zeros:
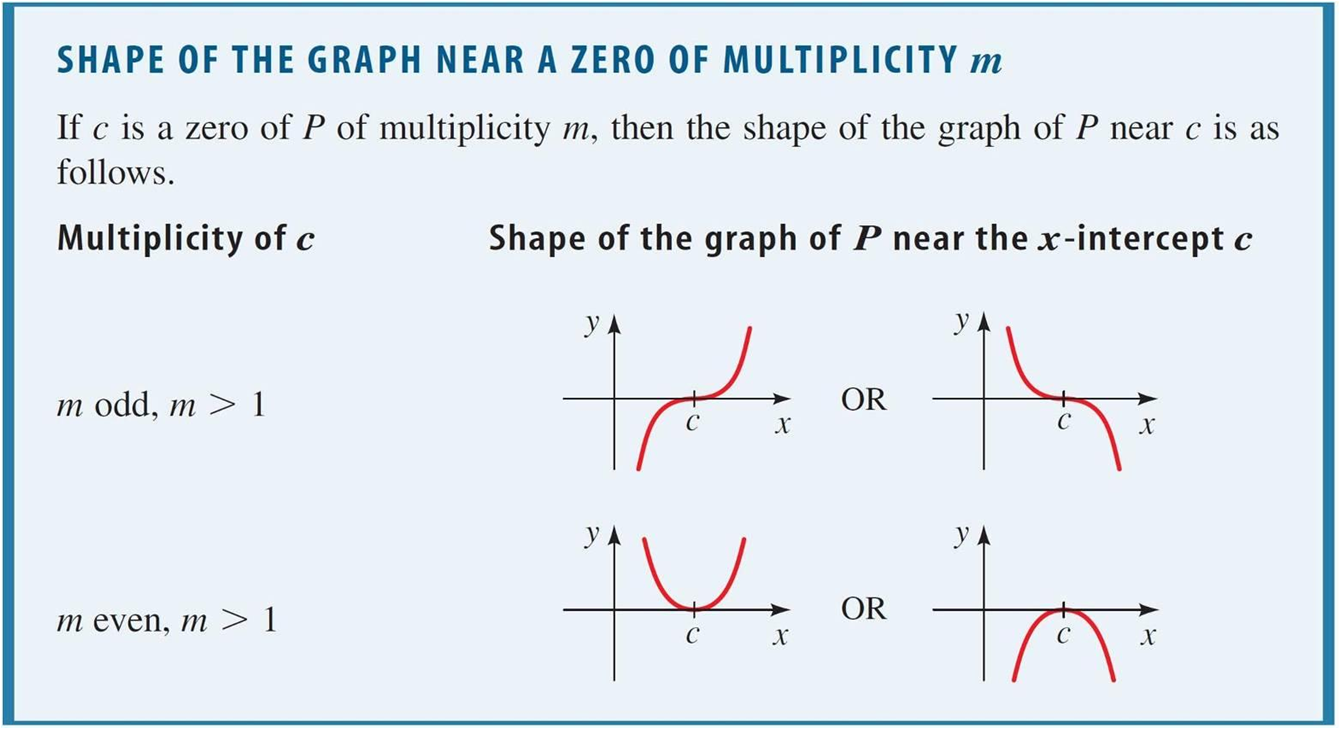
Actually the most common zero has m=1, and is not well represented here: it just looks like a straight line crossing the x-axis, from positive to negative (or vice versa).
- Local extrema (maxes and mins)

These points are important because we're often interested in maximizing or minimizing a function (e.g. minimize the costs, maximize the profits).