 (from Introduction to Global Climate Change, Arnold J. Bloom).
Sections 2.1 and 2.2 are entitled "What is a function?", and "Graphs of Functions".
This course is about functions. It might be called "The anatomy of functions." I like to speak of a "function zoo". The zoo has animals of many different types, and each animal species is different from every other. At the zoo we can easily distinguish between lions and parrots. I need you to just as easily distinguish between polynomials and trigonometric functions (even if neither will eat you!).
Our author represents a part of our zoo in our text on p. 159. These functions are given by formulas and by their graphs. These are fairly traditional ways of understanding functions.
We assume that you're acquainted with the idea of a function (although you may be a little rusty). In society you're expected to deal with functions.
(from Introduction to Global Climate Change, Arnold J. Bloom).
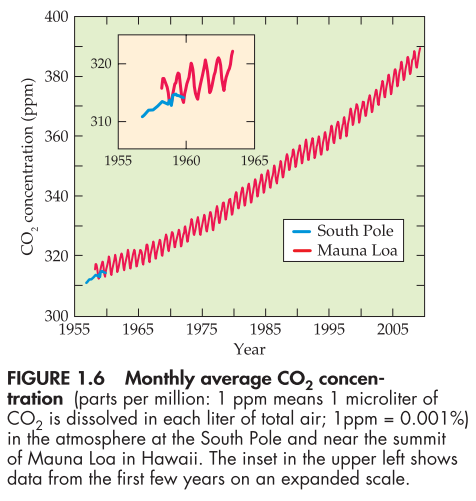
I'm interested in climate change, and in particular in the relationship between CO2 and global temperatures. The important question of interest relative to climate change is this: does the global temperature climb as global CO2 climbs?
But the graph of the data merely concerns the increase in CO2 with time....
On the other hand, the National Academy of Science has issued its verdict in a document Climate Stabilization Targets: Emissions, Concentrations, and Impacts over Decades to Millennia (2011):
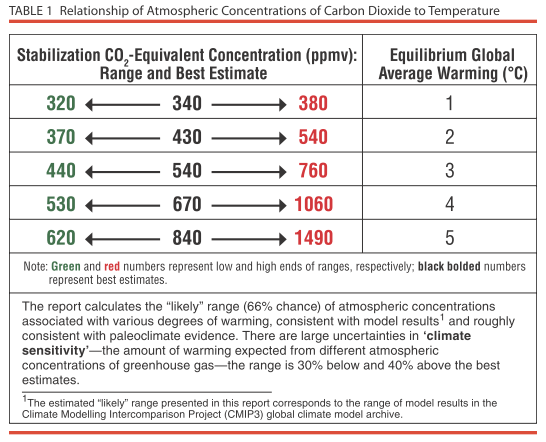
Notice a couple of things:
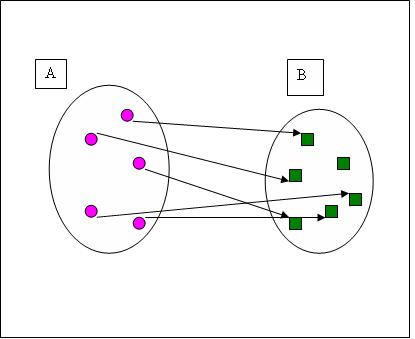
A functional relationship is given
For example, your grade in this course could be determined (uniquely) by your grades on the final, the hour exams, and the homework. We might write your grade G as
G(F,E,H)
or
G=g(F,E,H)
to indicate that your grade G is a function of these three "sub-grades". This is called a multivariate function, since G is a function of multiple (more than one) variables (F, E, and H).
By the way, notation is frequently one of the biggest stumbling blocks to understanding of mathematics. Why do we have two different, completely acceptible ways of writing the same thing? Should we?
In this class we'll focus on functions of a single variable (univariate functions). Are the following statements true in a formal or informal sense, or just plain false?
Many functions are given this way, as well -- verbally.
The next step in many real-world applications is modeling the data -- that is, creating a function that fits the data. So, for the Keeling data, one extremely important question is this one: What does the future hold for CO2?
To address that question we might want to model the Keeling data "function". What that effectively means is that we need to use the data to create a function that we can use to help us predict what will happen down the road.
Which of the functions in the function zoo seems the closest in form to the Keeling Data?
|
 |
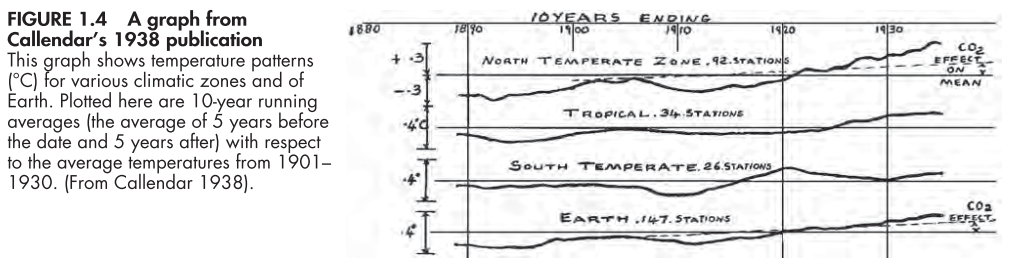
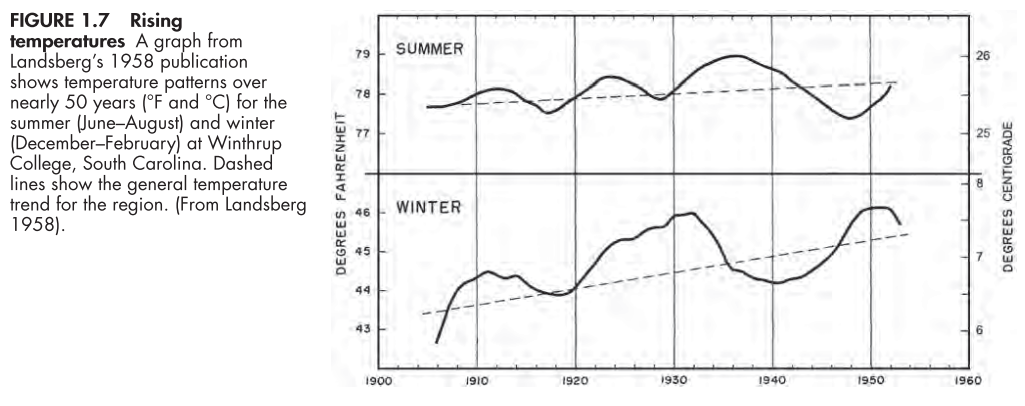
In the following we have temperature records from two early climate modellers. Each used a model from the zoo: which one? Was it appropriate?
 (from Introduction to Global Climate Change, Arnold J. Bloom).
 (from Introduction to Global Climate Change, Arnold J. Bloom).
In each case, the model is designed to capture a trend. Linear functions (with straight line graphs) do not resemble the data in either case, but capture the sense that the temperatures are increasing.
One of the things you've undoubtedly noticed about the Keeling data is that it wiggles as it increases. And none of our model functions wiggles! That's where the trigonometric functions of chapters 5 and 6 will come in....