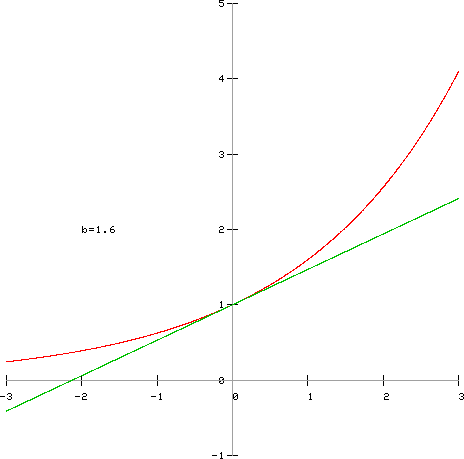
Notice that the tangent line has a slope of 1 somewhere around 2.7.
In fact, the tangent line to y=bx at the point (0,1) has a slope of 1 precisely when
This value is known as e (Euler's constant).

| Here is an animation of y=bx for a range of b values. | |
|
The graph is shown along with a tangent line to the curve
at the point (0,1).
Notice that the tangent line has a slope of 1 somewhere around 2.7. In fact, the tangent line to y=bx at the point (0,1) has a slope of 1 precisely when
This value is known as e (Euler's constant). |

|