- Announcements
- Section 001: sorry that we didn't get together yesterday!
- Anyone new to NKU?
- Thanks for signing up! I'm glad that you're here.
- No quiz this Thursday; generally we'll have quizzes on Thursdays (when we're not having exams).
- Today we'll
- get acquainted,
- go over course details,
- talk a little about what this course is about, then
- Section 001: you'll receive a take-home
diagnostic test
to predict how well you're going to do. It's strongly predictive of your success -- so it's worth doing. I hope that you'll take it very seriously, even though it does not figure into your course grade.
You will probably spend about 40 minutes on the test (no more than 50).
Bring your tests and answer sheets back Thursday.
- KEMTP Diagnostic Test:
- This is a calculator-free test.
- Do not write on the test itself. Write your answers on the answer sheet I provide, and use your own scratch paper if you wish.
- Please try your hardest, even though this will not be counted in your course grade. It is simply designed to help you to assess your preparation for this course.
- KEMTP Diagnostic Test:
- Section 002:
- Your diagnostic test results are in.
- Your diagnostic test results are in.
- Section 001: you'll receive a take-home
- Finally we'll have a bit of a review of sections 1.1 through 1.4, which will probably continue Thursday, to be followed by section 1.5.
- Roll
- 4x6 cards: Please fill out the card, indicating
- Name (first and last -- but use the name that you want me to call you).
- Hometown
- What is your calling? ("a calling has to do with one's larger purpose, personhood, deepest values, and the gift one wishes to give the world.... A calling is about the use one makes of a career." David Orr, Earth in Mind)
- What is your dream job?
- What is something special about you?
- Syllabus (logistics, etc.)
- The plan of attack: we'll get through (much of) chapters one
through five in Stewart.
Assignments will be updated on the website. Keep checking on those.... You have one already!
- You'll want access to either a copy of Mathematica, or a
calculator at least on a par with a TI-89 -- that is, a graphing
calculator with a "CAS" -- Computer Algebra System. I encourage you to download
your free copy of Mathematica.
However, your exams are going to be taken with only a scientific calculator, so you'll need one of those as well. But for your own work, I recommend a good graphing calculator and (even better) Mathematica.
These really reduce the tedium associated with some aspects of advanced mathematics, and allow you to check your work. That being said, since you'll have access to neither for the exams, you'll want to use these as aids, and not as crutches.
- The Calculus lab (MEP 457) may prove helpful.
- You should do the reading in advance of our discussion of
each section in class. Thursday we'll start working on section
1.5. Please read section 1.5, and
review the previous sections.
- Sign your classroom
agreement. Major upshot: no electronics (other than calculators) in
class....

The big ideas of Calc I are contained in Gil Strang's "Auto Analogy": he says that the "The central question of calculus is the relation between [speed and distance traveled]."
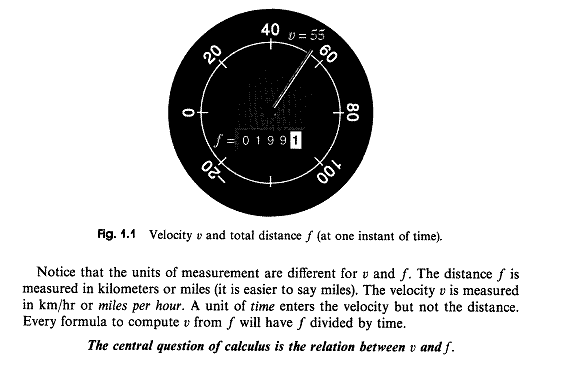
Imagine that the car is operated on a long, straight road. (Just for the sake of convenience, we won't allow it to travel in reverse! Otherwise we'd be talking about velocity -- speed and direction -- rather than just speed.)
- Given the graph of the speedometer readings over time, can we tell what the odometer reads over time?
- Given the graph of the odometer readings over time, can we tell what the speedometer reads over time?
Calculus answers both of these with a resounding "Yes!"
Each of these questions relates to the two fundamental subject matters of univariate calculus I:
- the differential calculus and
- the integral calculus.
How about more complex ones?:)
The velocity part is the derivative; the total distance part is the integral. At the beginning of this course, we're focused on derivatives, hence the velocity. In particular, we speak of "instantaneous velocity" -- the velocity at a single point in time.
The velocity is a rate of change: for a car in the US it's usually given in mph (miles per hour) -- that's the rate of change of your car's position with repect to time at a given moment.
That's what your speedometer is showing (or at least estimating).
By the way, you might check out Gil Strang's "Highlights of Calculus" from MIT on-line. One of my students thought they were the best thing ever for calculus, and he might be right.
Today we review sections that are considered pre-requisite for calculus (we teach them in our pre-calc course). Just a note: I generally create a "greatest hits" summary of each section -- you may want to check those out! I'll put a link to the appropriate one, every day we discuss a given section.
- 1.1: Four Ways to Represent a Function
- 1.2: Mathematical Models: a catalog of essential functions
- 1.3: New functions from old functions
- 1.4: The tangent and velocity problems
- Linear functions
- First of all, what is a function (p. 10)?
- Why do we care about them?
We use functions to represent or to model behavior. For example,
- There is a straight line (linear) relationship between celsius and fahrenheit:
$f(c)=\frac{9}{5}c+32$
or
$c(f)=(f-32)\frac{5}{9}$
(depending on whether you're Canadian or American!:)
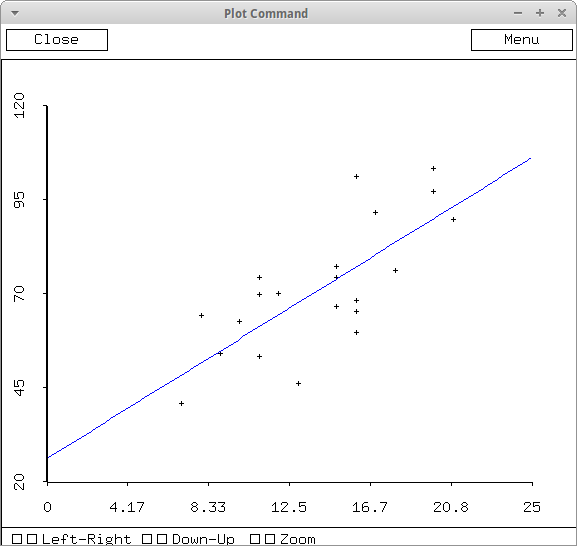
- Here's the regression equation (a linear model) for the
KEMTP tests from a recent section of our MAT128
course. The final course grade g was modelled by
$g(K)=3.1K + 27.3$
shown in blue in the following graphic, along with the actual results for the corresponding scores from the KEMTP test:
Final
Course
Grade
(%)
KEMTP score
- There is a straight line (linear) relationship between celsius and fahrenheit:
- Linear functions are the most important functions we use, members
of the polynomial family. Let's see how we can use them to
solve an important problem that you must recall from high school or
other times in your mathematical life:
How do you find the "right" graph window for a given function, $f(x)$? Here's an example, which leads to a couple of other important problems:
- How do we find a function's roots (places where $f(x)=0$)?
- How do we find places where a function hits high and low points -- "peaks and pits"?
In particular, Sir Isaac Newton, one creator of calculus, used linear functions to solve this problem.
How can we use linear functions to find roots of $f(x)$??
- Some examples of linear functions:
- Find an equation of the line that passes through the points (1,3) and (3,-1). Draw the points and the line.
- Write the equation in a different yet meaningful form.
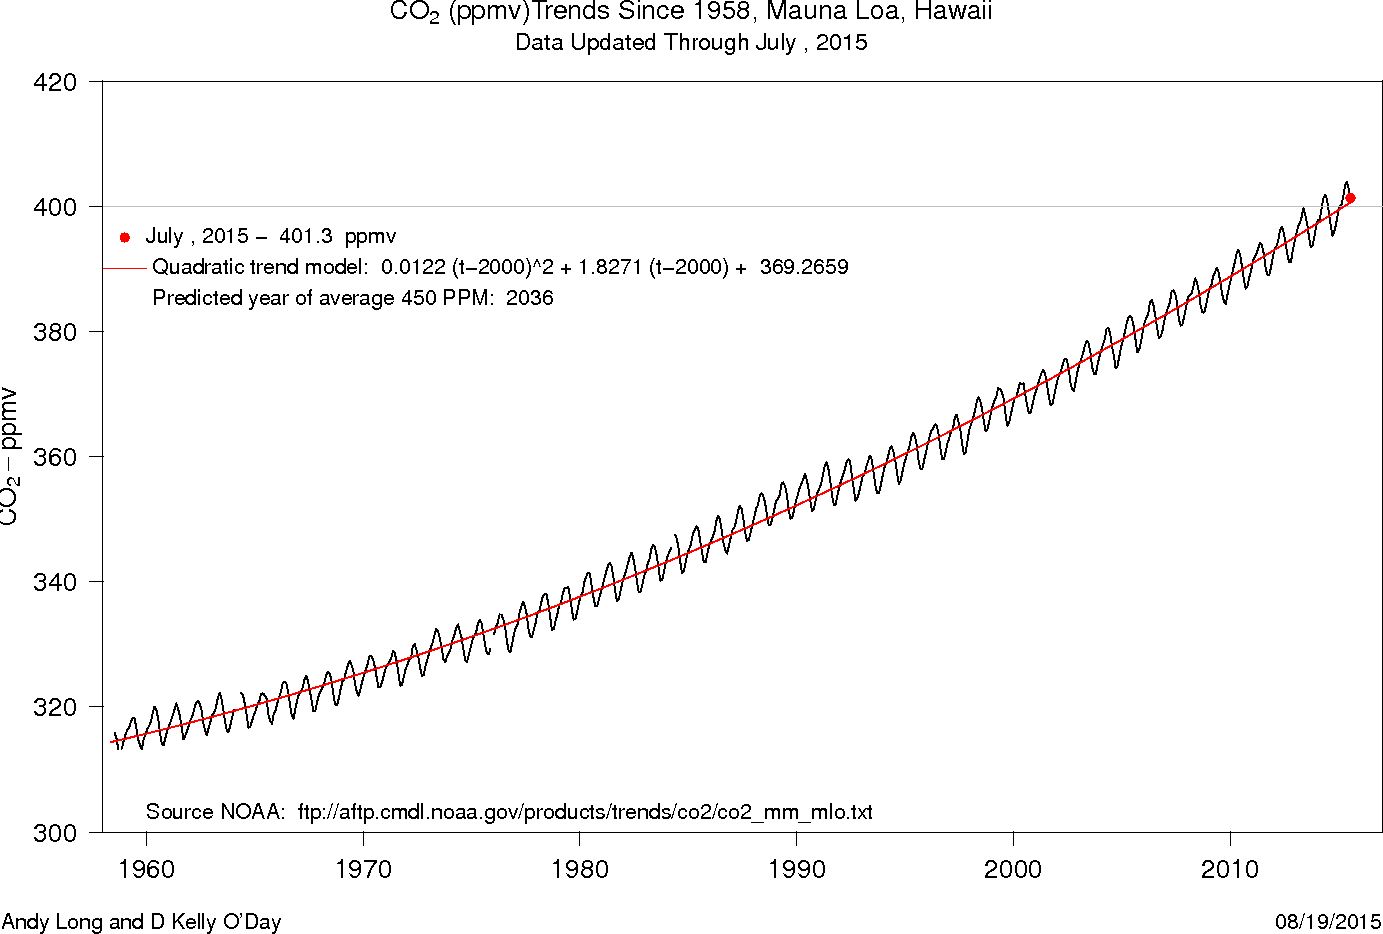
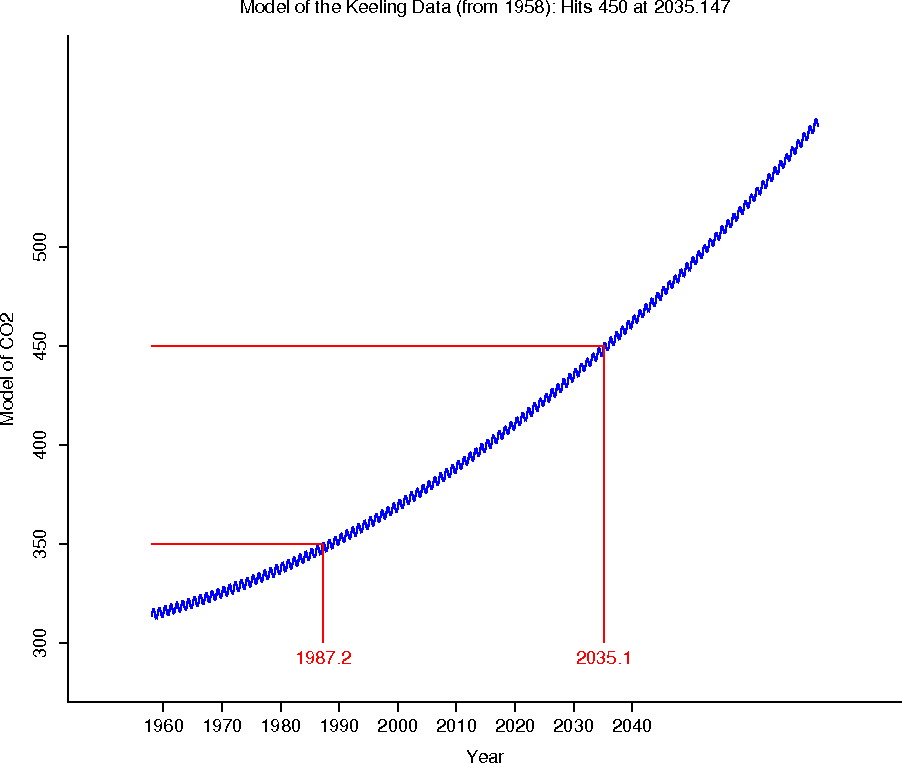
- Let's take a look at how this model can be used in a practical problem: the Keeling data, Example 2, p. 25.
- First of all, what is a function (p. 10)?
- Polynomial functions (p. 27):
- Quadratics: throw something, and you'll see a parabola. Graph a ball bouncing, and you'll notice something else interesting: cusps!
- Cubics are often used for splines. They are "pasted together" for design purposes (e.g. fonts for computers).
- Polynomials are the bunny rabbits of the zoo: smooth, defined everywhere, etc.
- Rational functions:
- Ratios of polynomials, $r(x)=\frac{P(x)}{Q(x)}$
- Polynomials $P(x)$ are also members of the rational function family (since $Q(x)=1$ is a polynomial, ).
- A really important example is $f(x)=\frac{1}{x}$ -- whose graph is
an hyperbola.
Our text also calls this a "reciprocal function" (p. 30).
- Rational functions can be rather feisty: they can have
vertical asymptotes -- places where a function "blows up" (or
"blows down").
So they may not be defined for all real numbers, but have "holes" in their domains.
- Power functions:
- $f(x)={x^a}$, where $a$ is a real number.
- If a is a positive integer, then these are polynomials, of course.
- These include square and cube roots (and our text calls these "root functions" -- p. 29).
- Power functions may also not be defined for all real numbers -- in fact, they may be defined for only half the real line. See the figure below, for the root functions.
- Here is a summary so far, plus some other unusual functions which
we should note:

Let's observe a few things:
- symmetry: even and odd functions are represented here
- Even: symmetric about the y-axis:
- Odd: symmetric about the origin by rotation of 180 degrees:
- Even: symmetric about the y-axis:
- Functions with restricted domains.
- Functions with corners (in particular, the absolute value).
- Functions with breaks (discontinuities), either infinite or finite. For those of you with a computer science background, the Greatest integer function is sometimes called the "floor" function.
- symmetry: even and odd functions are represented here
- Trigonometric functions
- capture oscillatory behavior
- Are periodic (repeat in space or time).
- You should know important properties of sine and cosine (p. 31), and be able to draw them at the drop of a hat! By the way, sine is an odd function; cosine is even.
- We see the need for a trigonometric function in the example below.
- In the end we may mix up the members of the function zoo in a model. For
example, which members might play a role in doing a really good job of
modelling the Keeling data from Mauna Loa?

Here are several of my current models of the trend, using a quadratic:

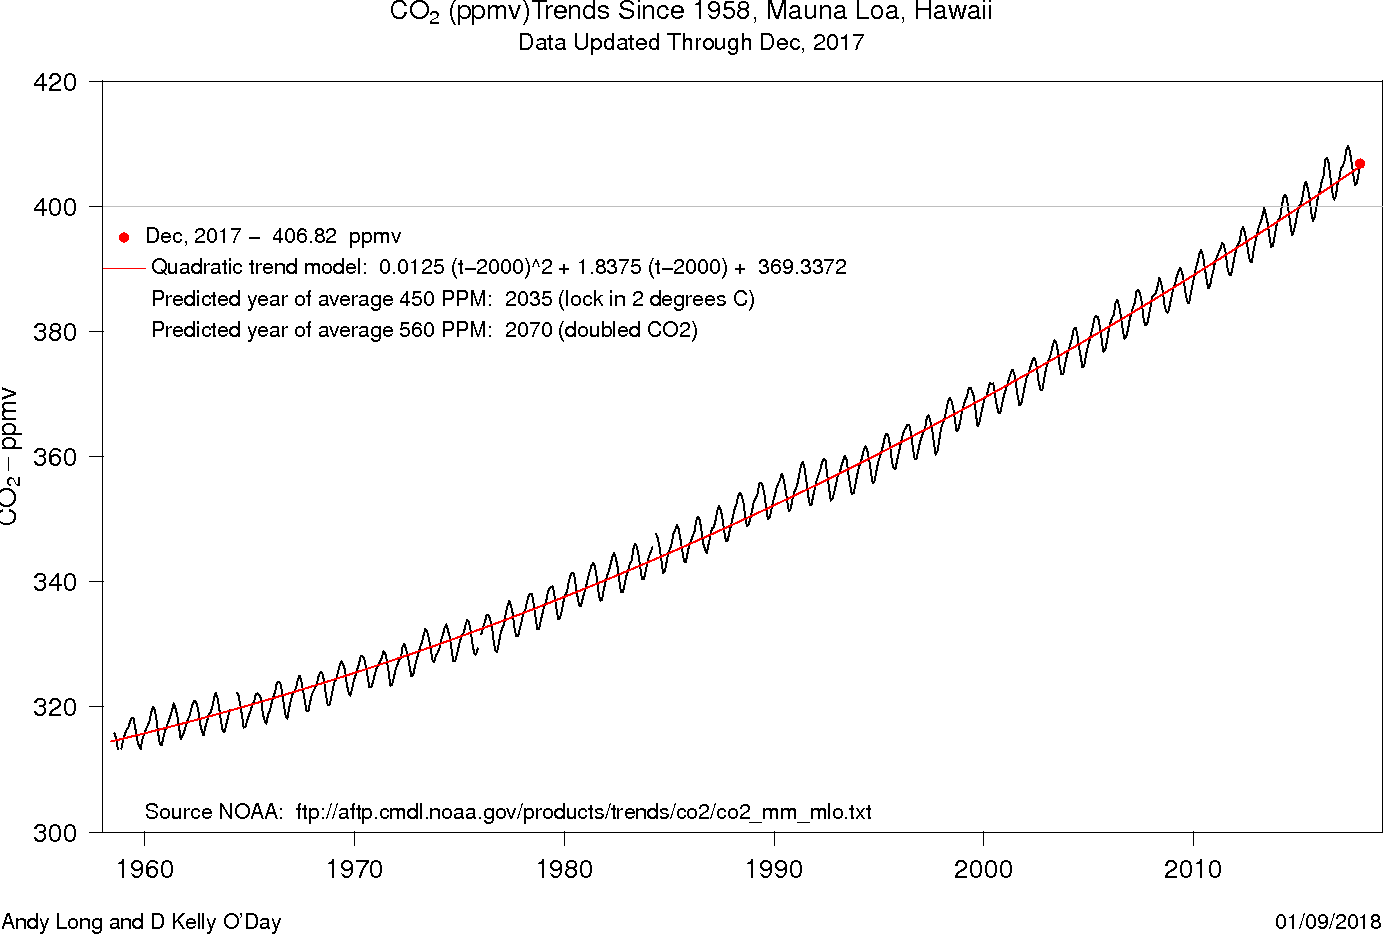
and here is one using a quadratic for the trend, but including the oscillations modelled by a sine function:
- Now, on to section 1.4: instantaneous velocity (and tangent lines)
The instantaneous velocity is a curious idea: how fast are we going at exactly this moment? Here's a graph of one of Usain Bolt's 100 meter races from 2008:
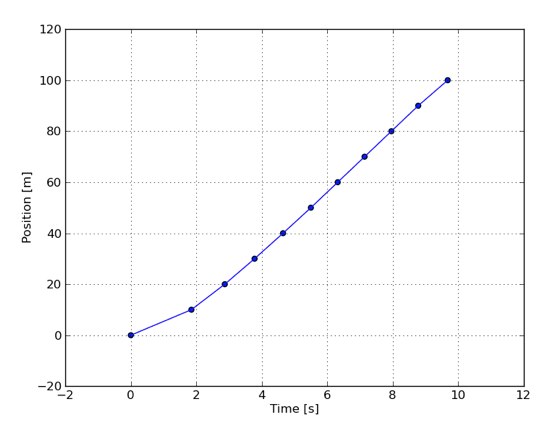
A race usually concludes with a time, but we can turn it into an average velocity, instead: Bolt ran at an average rate of about
$\frac{100m}{9.8s}=10.02\frac{m}{s}$ Do you really think that there are corners in his progress (e.g. at 2 seconds)? We don't believe that -- we just don't have data at every moment -- the more data we have, the smoother this graph will look.
In calculus we talk about limits: we'd like to have an unlimited supply of data -- data at every moment -- but that would be an infinite amount of data to plot, which would take infinitely long -- and we're just not that patient.
So we try to predict that the graph would look like "in the limit", where the difference between data values goes to zero. The limiting difference becomes "infinitesimally small"; becomes zero, essentially.
- Why are we concerned with "limits"? This slide
show illustrates the approach of the secant lines to the tangent
line for a smooth curve. It's one of the first important problems
we'll want to address in calculus. It's why we're interested in
limits of things at the outset.
Notice the focus on linear functions: linear functions are the most important functions in calculus.
- Let's look at some examples from 1.4, using Mathematica. We'll be
using Mathematica extensively in this class, so the sooner you get your
copy, the better!