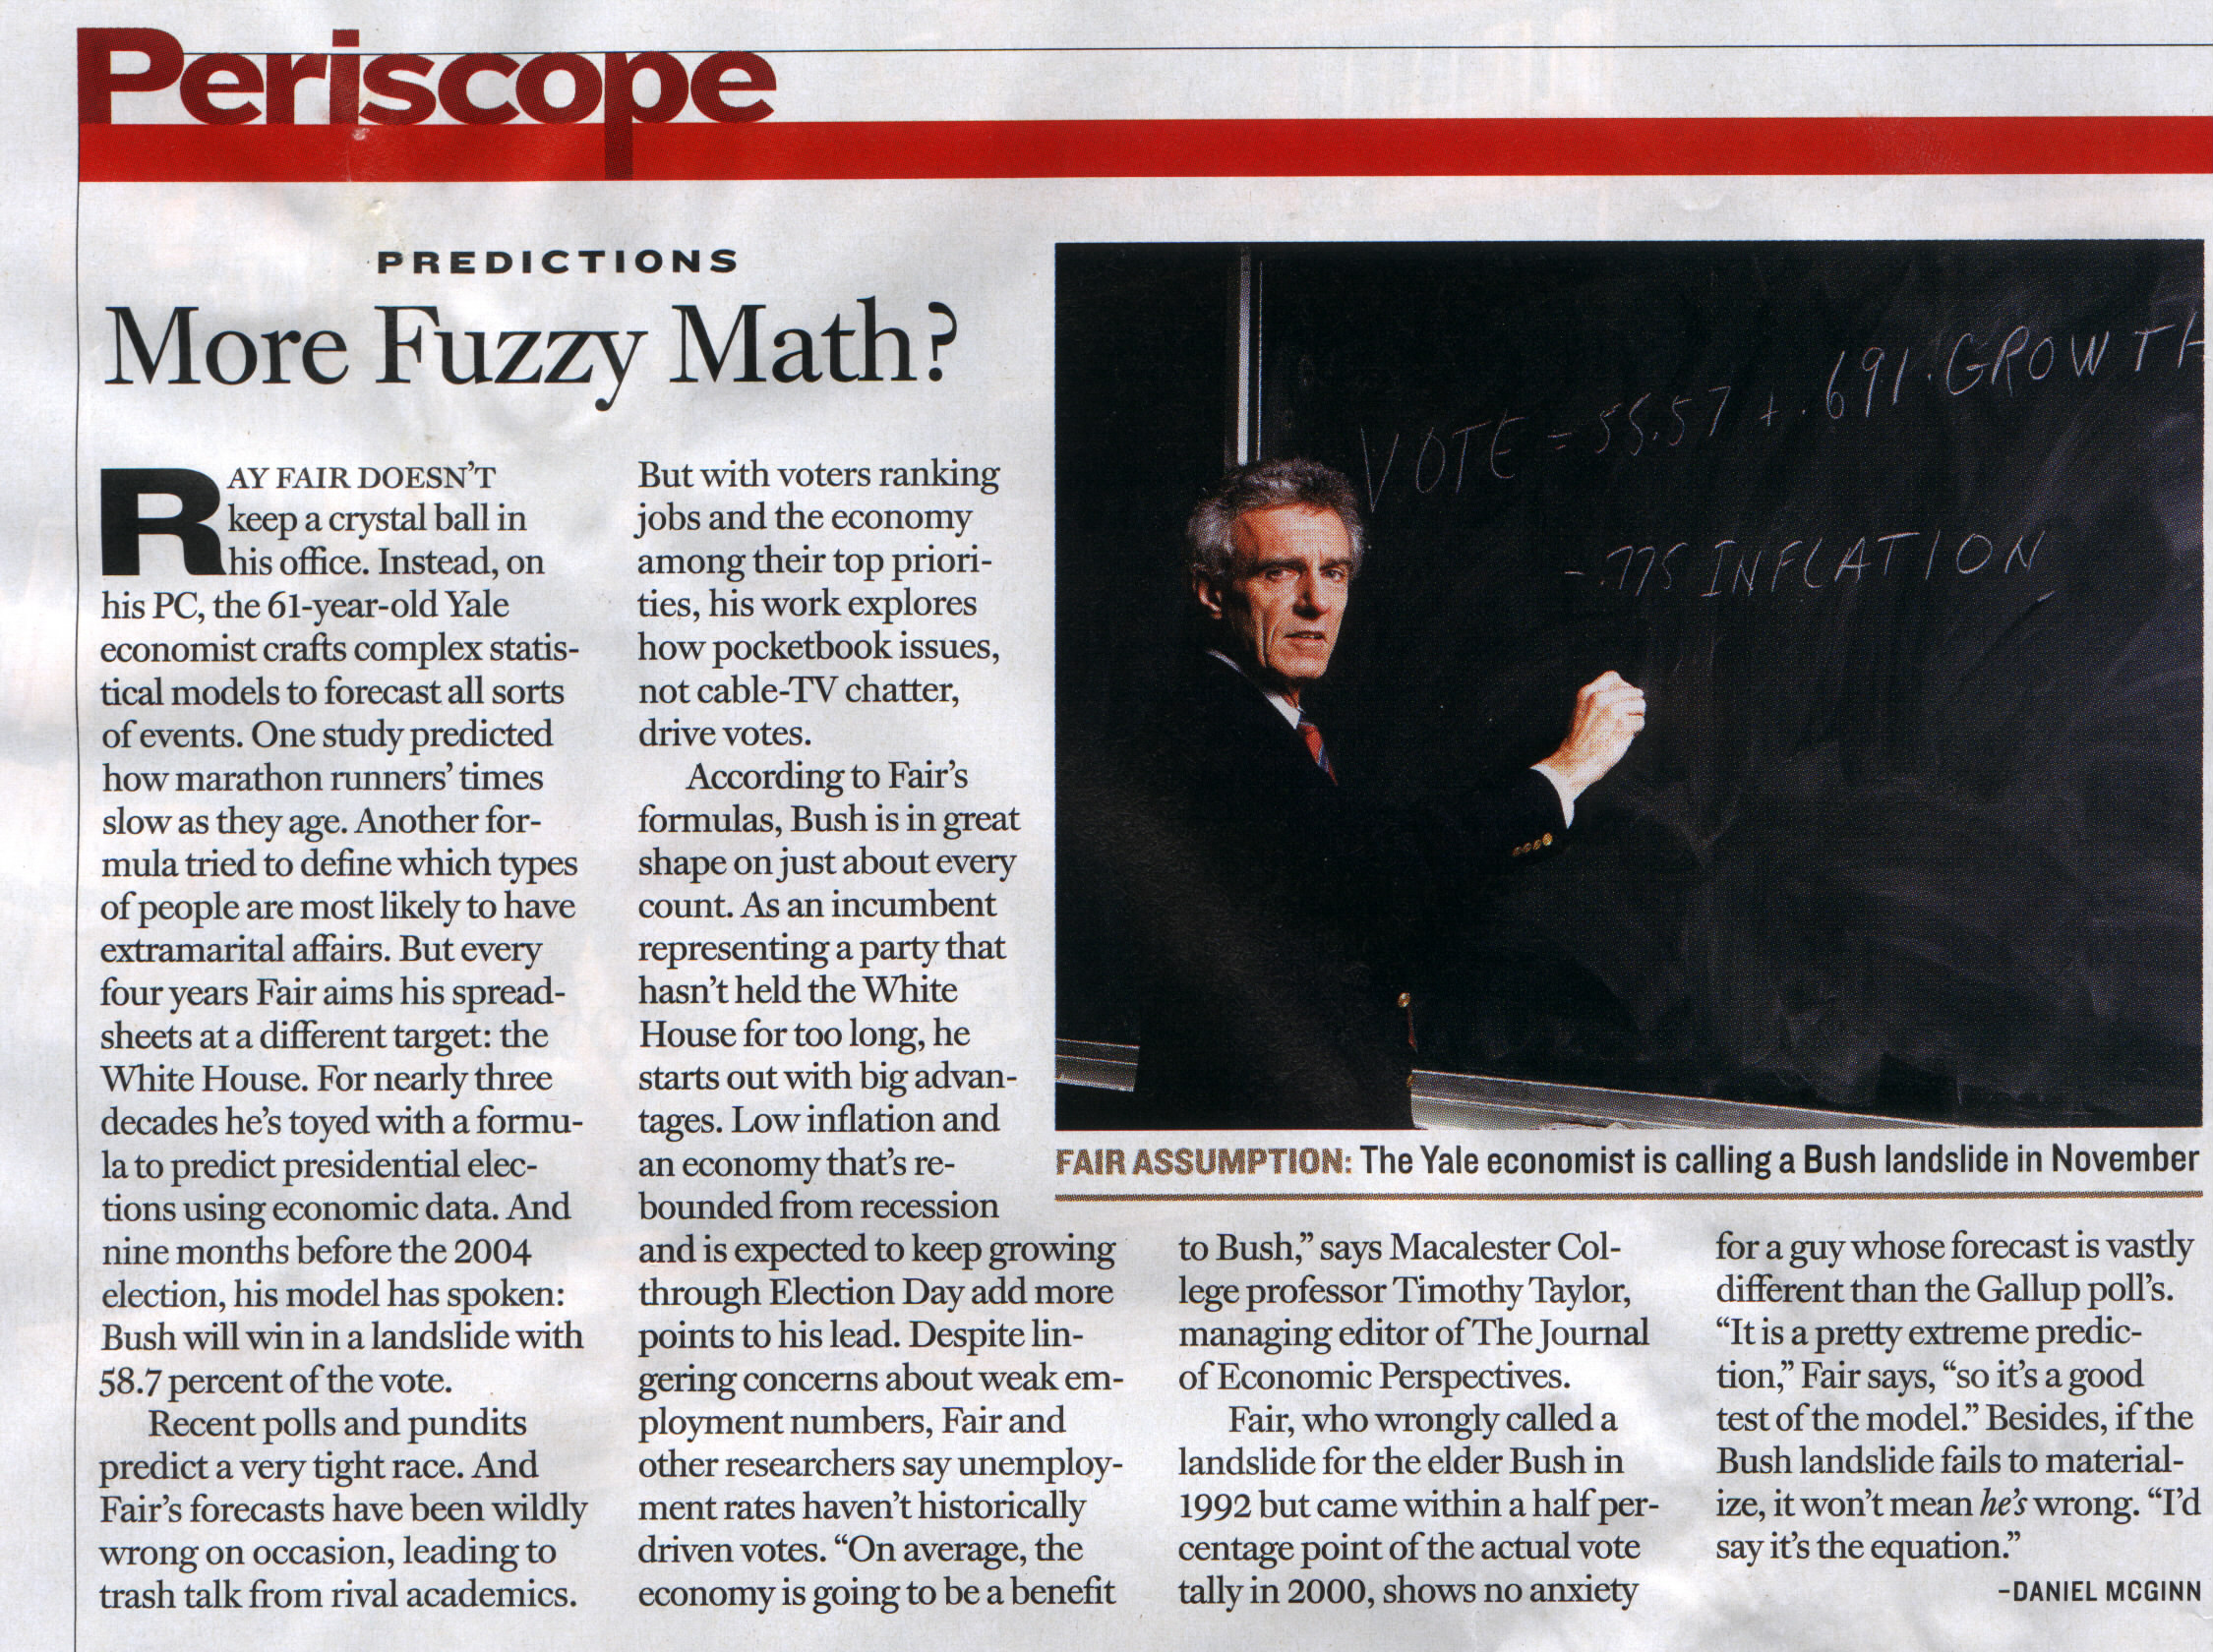
Here's the current equation. It's linear:
The good news is that with even a smattering of mathematical ability, some yahoo can make the cover of Newsweek. With the following data the guy derived a linear model, which any statistical package can do.
        VOTE PARTY PERSON DURATION WAR   GROWTH   INFLATION GOODNEWS

 1880  50.220   -1    0     1.75    0     3.879      1.974     9
 1884  49.846   -1    0     2.00    0     1.589      1.055     2
 1888  50.414    1    1     0.00    0    -5.553      0.604     3
 1892  48.268   -1    1     0.00    0     2.763      2.274     7
 1896  47.760    1    0     0.00    0   -10.024      3.410     6
 1900  53.171   -1    1     0.00    0    -1.425      2.548     7
 1904  60.006   -1    0     1.00    0    -2.421      1.442     5
 1908  54.483   -1    0     1.25    0    -6.281      1.879     8
 1912  54.708   -1    1     1.50    0     4.164      2.172     8
 1916  51.682    1    1     0.00    0     2.229      4.252     3
 1920  36.119    1    0     1.00    1   -11.463      0.000     0
 1924  58.244   -1    1     0.00    0    -3.872      5.161    10
 1928  58.820   -1    0     1.00    0     4.623      0.183     7
 1932  40.841   -1    1     1.25    0   -14.557      7.160     4
 1936  62.458    1    1     0.00    0    11.677      2.454     9
 1940  54.999    1    1     1.00    0     3.611      0.055     8
 1944  53.774    1    1     1.25    1     4.433      0.000     0
 1948  52.370    1    1     1.50    1     2.858      0.000     0
 1952  44.595    1    0     1.75    0     0.840      2.316     6
 1956  57.764   -1    1     0.00    0    -1.394      1.930     5
 1960  49.913   -1    0     1.00    0     0.417      1.963     5
 1964  61.344    1    1     0.00    0     5.109      1.267    10
 1968  49.596    1    0     1.00    0     5.070      3.156     7
 1972  61.789   -1    1     0.00    0     6.125      4.813     4
 1976  48.948   -1    0     1.00    0     4.026      7.579     4
 1980  44.697    1    1     0.00    0    -3.594      7.926     5
 1984  59.170   -1    1     0.00    0     5.568      5.286     8
 1988  53.902   -1    0     1.00    0     2.261      3.001     4
 1992  46.545   -1    1     1.25    0     2.223      3.333     2
 1996  54.736    1    1     0.00    0     2.712      2.146     4
 2000  50.265    1    0     1.00    0     1.603      1.679     7
Here's another article about such models.