-
GIS is great for hypothesis generation: suddenly you see your
data in relation to the nuclear power plants in the area, to the rivers
and streams in the neighborhood, or even to the neighborhoods
themselves.
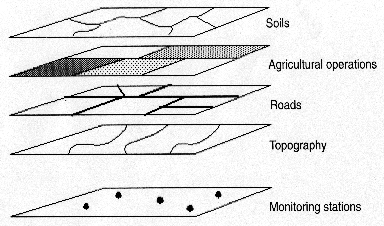
This is accomplished by a system of overlays: we put data in the context of other data, which are all mapped into the same area of study. We will see that these data are of four types in general: point, line, area (polygon), and raster (grid) data.

-
linear and areal dimensions (e.g. distances from point to
point, size of an area in miles, length of a stream).
- unfortunately, GIS packages have been slow to add
analysis functionality that epidemiologists require (e.g. the spatial
statistics that we will talk about in this course). This is being rectified
quickly, however, by large GIS firms such as ESRI, and by smaller firms such as
BioMedware.
