A test for temporal clustering in one or more time series. It is sensitive to single clusters such that cases occur at about the same time, and measures the dispersion of cases about a central time period. Currently the software provides two tests for temporal clustering; within the individual spatial units and across all spatial units simultaneously.
Data Requirements
Counts of cases in consecutive time intervals
Analysis
H0: cases occur randomly through time
Ha: cases cluster about a single point in time
Test Statistic: The test statistic K, measures the tendency of time periods with at least one case to form a single cluster in time:
Where m is the number of time periods with at least one case, yi is the time assigned to the ith cell in which a case occurred. The index (r+1) is the Ďcentral mostí time cell that contained a case
(![]() ). K will be small when cases form a single time cluster.
). K will be small when cases form a single time cluster.
The expectation and variance of K under the null hypothesis are:


Where delta(
m) = r-2 when m is odd, and delta(m) = 2r-1 when m is even. The test statistic K can be expressed as a z-score which is expected, under the null hypothesis of a random allocation of occupied cells across the time series, to be normally distributed with a mean of 0 and unit variance:
A z-score of 0 is consistent with a random allocation of occupied cells across the time series. K will be smaller than its expectation when occupied time intervals form a unimodal cluster, and the z-score will be less than 0. A uniform distribution of occupied time intervals through time will cause K to be larger than its expectation, and the z-score will be greater than 0. K will also be large when occupied time intervals form several clusters, and Larsenís method thus cannot distinguish a uniform distribution from multiple clusters. Significance is therefore evaluated as a one-tailed test describing the probability, under the null hypothesis, of obtaining a K as small or smaller than the observed. This p-value is obtained by comparing the z-score to the percentiles of the normal distribution.
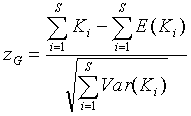
When the data consist of several time series the K statistics from each time series can be combined into an overall z-score as

This grand z-score tests for an overall departure from the expected values across all time series simultaneously. The individual z-scores test for unimodal clustering within each time series. You must examine the individual z-scores before concluding whether a significant grand z-score is due to unimodal clustering in all of the time series, or to some other combination of temporal pattern across time series.
For each time series:
Plot K on its expectation (E(K))
Reference
Jacquez, G.M. 1994, User manual for Stat!: Statistical software for the clustering of health events, BioMedware, Ann Arbor, MI.