A test for spatial autocorrelation in disease rates. Positive spatial autocorrelation means that nearby areas have similar rates, indicating spatial clustering.
Let's think of the areas as counties (although they could be any geographic unit).Disease rates linked to connection weights for locality pairs
Number of Monte Carlo runs to perform
Analysis
H0: disease rates are spatially independent and assigned at random among the regions
Ha: disease rates are not spatially independent
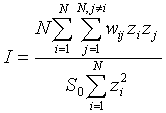
Test Statistic: Moran's I is a weighted product-moment correlation coefficient, where the weights reflect geographic proximity. Values of I larger than 0 indicate positive spatial autocorrelation; values smaller than 0 indicate negative spatial autocorrelation.
where N equals the number of regions, wij is a weight denoting the strength of the connection between areas i and j, zi is the rate in region i centered about the mean rate (using zi = xi - ave(x); xi is the rate in region i); and So is the sum of the weights,  . The weights reflect how "connected" we think two areas are, and usually reflect geographic proximity. Moran's I is used to determine whether "connected" areas are more similar to one another than would be expected under spatial randomness. It asks: Do the rates in connected areas covary? Nearby areas tend to have similar rates when their populations and exposures are alike. When rates in connected (nearby) areas are similar Moran's I will be large and positive. When rates in connected areas are dissimilar Moran's I will be negative.

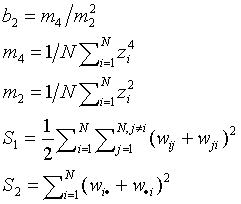
The expectation becomes close to 0 as N increases. The variance of I is determined under two null hypotheses or assumptions: Normality (denoted N) or randomization (denoted R). Under assumption N the rates are sampled from a population whose distribution is normal. Under assumption R the rates are random samples from a population whose distribution is unknown. Assumption N is useful when we have good reason to believe the observations follow a normal distribution. Assumption R is less restrictive and, since we often don't know their theoretical distribution, is appropriate for disease rates. The variance under assumption N is:

Under the assumption R the variance is:

where a falling factorial is written s(b)=s(s-1)...(s-b+1),
and where

The significance of Moran's I is evaluated under assumptions R and N, and also by Monte Carlo simulation. For assumptions N and R z-scores are expressed as the difference between the observed and expected value of I in standard deviation units.
P-values
Plot of Moran's I under simulation
Reference
Jacquez, G.M. 1994, User manual for Stat!: Statistical software for the clustering of health events, BioMedware, Ann Arbor, MI.