Ripley's K function
Ripley's K function is a statistic useful for
point pattern analysis.
Here are
more details on the use of Ripley's K, and other more general
functions, while this document summarizes
the information I used to create the test in GeoMed.
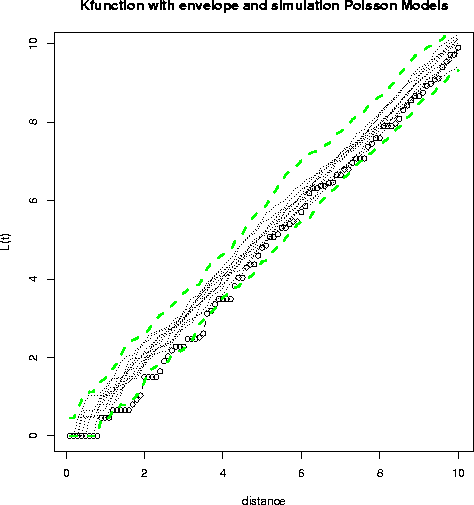
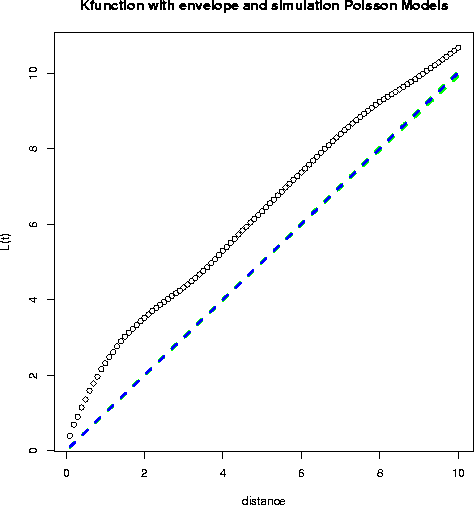
Ripley's K function for the data is compared with the expected line
y=x under Poisson distribution of the points (actually, a scaled
version of K is used, called L: L is the square root of the quotient of K
and pi). In addition, simulated Poisson fields of the same N for the same
size study area are generated, as are corresponding Ripley's K functions;
these give some idea of how extreme the result of the data's Ripley's K
function is.
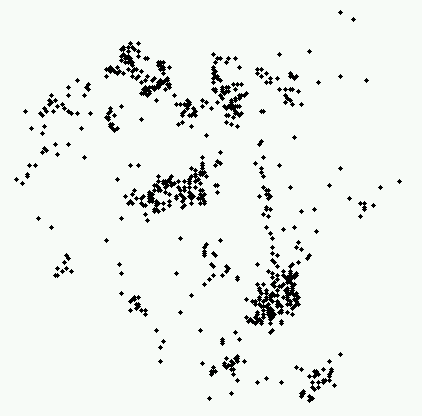
Example: towns data, the sample data for the use of Ripley's K function in
Splus.
In this data, a distance of 10 is about a quarter of the
way across the point space in either direction.
- We begin with a plot of the data:
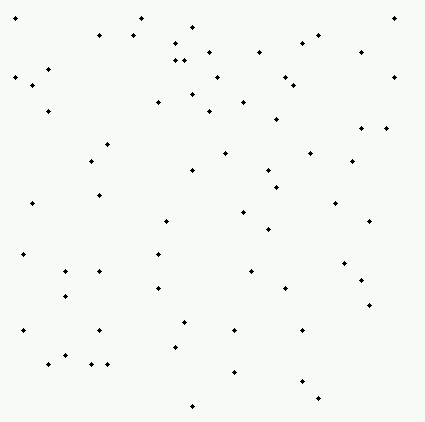
When I look at this pattern does not look
significantly different from a Poisson pattern; when someone with a little
more experience (like Dr. Art Getis) looks at it, they find that the pattern
appears roughly evenly spaced in a roughly homogeneous plane (i.e. more
regular than a Poisson process would produce).
- This first plot is produced in R; the envelope shown is for 100 Poisson
simulations (only 10 simulations are actually shown).
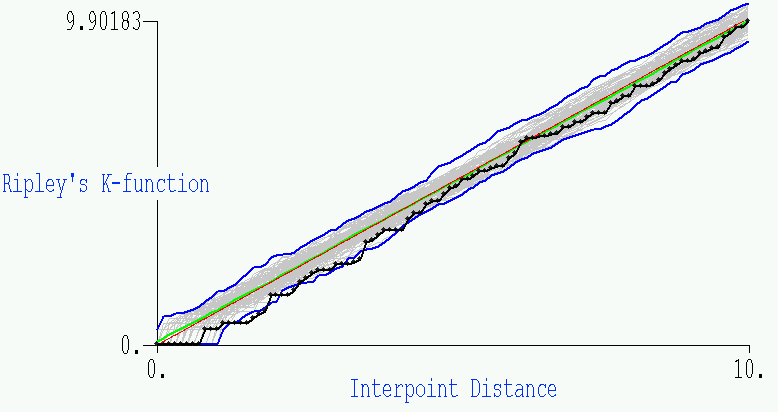
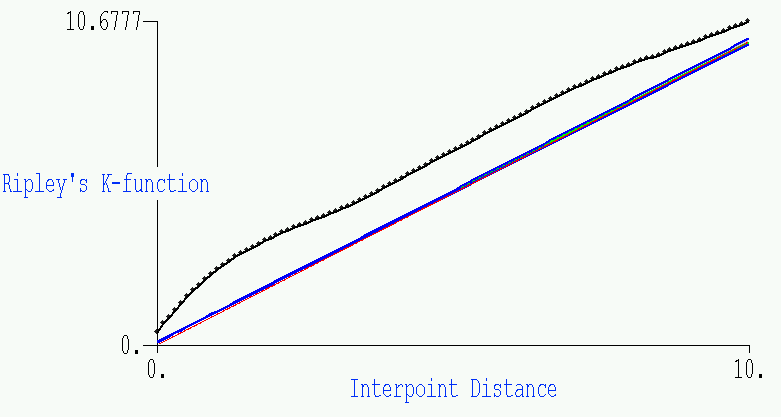
- This second plot is the related GeoMed output, where we show the same
information (although the blue envelope is for the 10 simulations shown). The
actual results from the data are given by the black function, with the
points added on to show the 100 subintervals for which the function is
plotted. The green and red in the center represent the average simulation
and the function f(x)=x, respectively.
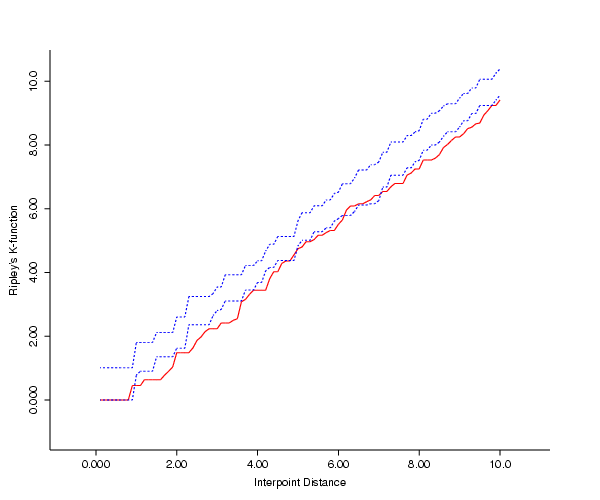
- The third plot was created in Xlispstat using the output of the web
version of Dr. Getis's
PPA software. PPA doesn't allow any adjustment of the region, but uses
the minimum bounding rectangle (i.e., uses as rectangular boundaries
the max and min x, y points). This was a convenience for the programmers,
and Dr. Getis notes that one should use the actual study boundaries. In R
one of the inputs is the bounding rectangular region for the point data;
I've included this option in the GeoMed software.
- What conclusion might we draw? The fact that the K function of the data
seems low by comparison with the Poisson simulated plots for small values of
h might be interpreted as follows: towns are not likely to be located too
close to each other, for, as Dr. Getis says, "the competitive economies of
towns, especially in agricultural areas, requires that they be dispersed
rather than random or clustered."
Example: Diggle's data
an additional sample data set (provided by Peter Diggle for entirely other
purposes!). In this case, a distance of 10 is about half way across the
point space in either direction.
- Again, we begin with a plot of the data:
As you can see, this pattern is significantly different from a Poisson
pattern, with a very high intensity of cases close together.
-
-
- What conclusion might we draw? Obviously the Diggle data is
significantly non-Poisson; the data cluster much more than expected under
Complete Spatial Randomness, at least for scales below 10.
Dr. Getis makes the following observation: "the distance at which the L(t)
observation is above the random expectation (the dashed line) defines the
extent of the clustering. In this case, I roughly make it out to be at a
distance of 2. When the slope of the observed function becomes less than
the random expectation, there is no longer a tendency for clustering.
Notice that the clusters are about 2 in diameter."
Acknowledgement: Thanks to
Dr. Art Getis for taking a
critical look at this analysis, and making many useful suggestions.
Dr. Getis, of San Diego State University's Department of Geography and
an expert and author in the field of spatial statistics, suggests that
another comparison plot that is of interest is the comparison of
two plots, e.g., a disease distribution and a susceptibles distribution.
Website maintained by Andy Long.
Comments appreciated.
longa@nku.edu