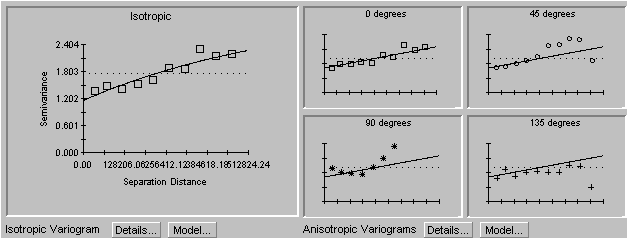
Note that the software gives us four directional variograms too, so that we can decide if an isotropic model is a good idea. In this case, it doesn't look too bad. Note also the sample mean, which is shown with the straight dashed line in the plots. The model that was plotted (and additional possible models) are shown in another screen:
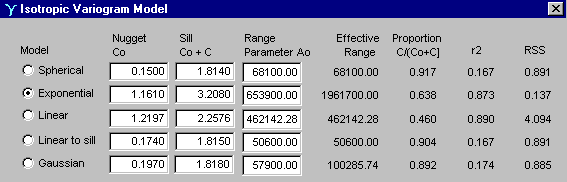
Note that the exponential model was chosen - don't know why GS+ took that one, but guess that it's the r-squared it calculates.
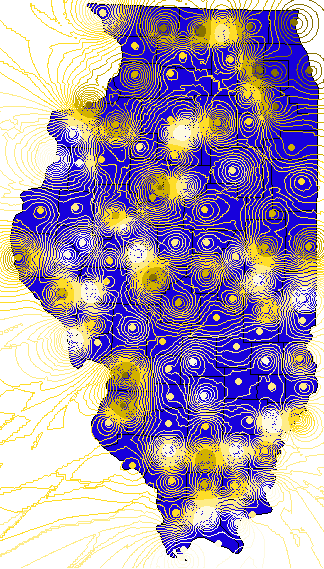
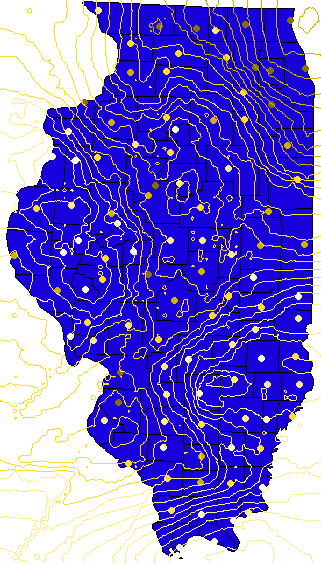
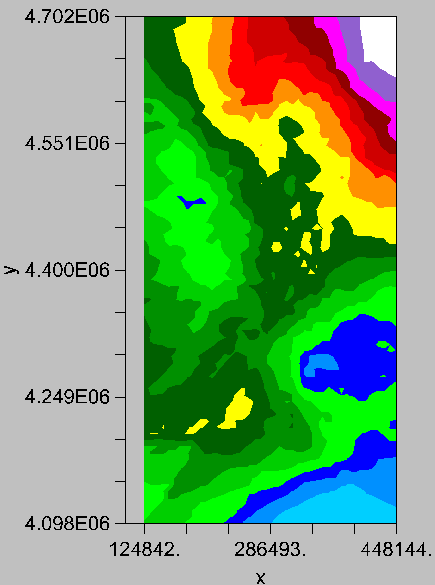
Can you guess which is which? They are obviously not the same! The ArcView map (on the left), created using Inverse Distance Weighting, has much more "confidence" in the data than does the kriging map. See how the IDW map swoops up to meet the data points: the kriged map won't do that, because of the nugget in the model.