) while nearest neighbor and designer metrics are often asymmetric. To save space, Gamma symmetrizes proximity metrics using
3.6 Proximity Metrics using the Gamma Software
Gamma is software for constructing and conducting randomization tests of spatial data. For instructions on obtaining Gamma see Appendix C. This section briefly describes how proximity metrics are calculated in Gamma, and provides brief exercises.
Spatial entities are often represented as points, lines and polygons, referred to in this discussion as entity types. A simple collection is comprised of only one type of entity, such as a set of points. A complex collection is comprised of several different types (e.g. points, lines and polygons together). Proximity relationships must be carefully defined, and for this reason we focus on proximity relationships among simple collections. We may wish to calculate proximity metrics within a collection (e.g. interpoint distances), and also as mediated by other collections (e.g. distances from one point to another on a network). Hence proximity relationships may involve only one collection (as for interpoint distances), or two collections.
We have defined 3 types of proximity metrics (geographic distance, adjacency, and nearest neighbor), and 3 types of entities (point, line, polygon), whose proximity relationships may be mediated by a collection of 3 other types of entities. This yields 27 different possible kinds of proximity relationships. In practice, sample locations are typically represented as points. For example, the location of a trap, the coordinates of a health event, the centroid of a polygon and so on. For this reason the proximity metrics in Gamma are calculated among points, and may or may not be mediated by a second collection. Nine proximity metrics may be calculated using the Gamma software (Table 3-2).
Table 3-2. Description of Gamma's proximity metrics.
As noted in Table 3-1, distance, adjacency and weight metrics are symmetric () while nearest neighbor and designer metrics are often asymmetric. To save space, Gamma symmetrizes proximity metrics using
 (3-10)
Symmetrizing the metric has no effect on statistics calculated using the gamma product. Calculation of proximity metrics is illustrated in exercises 3-1 through 3-9.
Exercises:
(a) Exercise 3-1: Nearest neighbors
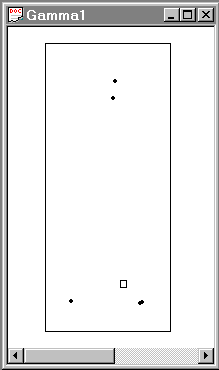
Summary: Calculate k nearest neighbor relationships among a set of points. This exercise uses a simple data set of 5 points mapped in Figure 3-9.
|
Figure 3-9. Data and sample locations in Chapter_3.pnt. |
Protocol:
The rows and columns correspond to the rows of the input data set. For example, the underlined element is n21 and indicates point 1 is the first nearest neighbor of point 2.
Problem: Construct the digraph (that is, a graphical representation of the links between sites) of k=1 nearest neighbor relationships for the sample locations in Figure 3-9, and write the proximity matrix (recall the definition). Compare your proximity matrix with that given above: are they the same?
(b) Exercise 3-2: Adjacency, point buffered
Summary: Calculate adjacency among the locations in exercise 3-1 using buffering. A buffer of radius 15 is used.
Protocol: Follow the protocol in Exercise 3-1 (you may choose a New session from the File menu), with the following changes:
The underlined element is a21 and indicates points 2 and 1 are connected.
Problem: Construct the digraph at this buffer radius by imposing the connections in the proximity matrix onto the map of sample locations. Change the buffer radius to 5 and remap the connections. What happens to the connection map?
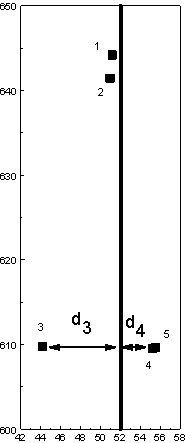
(c) Exercise 3-3: Adjacency, line buffered
Summary: Calculate adjacency among the locations in exercise 3-1 using line buffering. A buffer of radius 2 is used.
Protocol: Follow the protocol in Exercise 3-1, with the following changes:
The underlined element is a21 and indicates points 2 and 1 are both within the buffer region of the line (Figure 3-10).
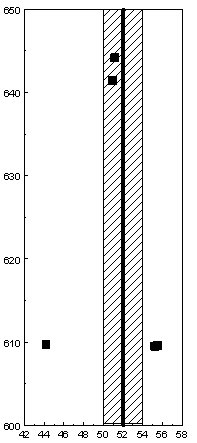
Figure 3-10. Map of line in the feature file Ch3_line.bna (solid vertical line), and its buffer (cross-hatched region). Points 1 and 2 are in the buffer zone and are adjacent. Note that the "line" should really be segment: the line drawn has been extended beyond the segment's actual extent: it should run from a y value of 609 to 645.
Problem: The line in the feature file consists of only two points, as recorded in the feature file Ch3_line.bna. Open this file using notepad or another ASCII editor. It has the following format:
The first line contains an identifier for the line (360590000002), two optional fields (NOT_USED) and a negative integer (-2). The `-' indicates the object is a line; positive integers are used for polygons. The line is comprised of two points, with coordinates (52.0, 609.0) and (52.0, 645.0). The line is drawn between these points. Create a new file called `myline.bna' and copy in the above data. Change `-2' to `-3' (for three points) and insert `44.0, 610.0' in the file immediately after `52.0, 609.0'. The line specified in `myline.bna' now starts at (52.0, 609.0) and extends to (44.0, 610.0); from there it proceeds to (52.0, 645.0). Calculate the line-buffered adjacencies in Gamma using this new feature file and a buffer radius of 2.0, and output the proximity matrix. How have the adjacencies changed relative to those obtained earlier? Relate any changed adjacencies to the new line geography.
(d) Exercise 3-4: Adjacency, polygon buffered
Summary: Calculate adjacency among the locations in exercise 3-1 using polygon buffering. A buffer of radius 5 is used.
Protocol: Follow the protocol in Exercise 3-1, with the following changes:
|
0.0 0.0 0.0 0.0 0.0 0.0 0.0 0.0 0.0 0.0 0.0 0.0 0.0 0.0 0.0 0.0 0.0 0.0 0.0 1.0 0.0 0.0 0.0 1.0 0.0 |
|
The underlined element is a54 and indicates points 4 and 5 are both within the buffer region of the polygon (Figure 3-11).
Problem: The feature file Ch3_poly.bna is as follows:
The first line indicates the polygon ID (360590000002), two label fields (not used), and a positive integer (5) indicating the number of points comprising the vertices of the polygon. The polygon closes on itself, and the last coordinate (52.0, 613.0) repeats the first. Create a new bna file specifying a polygon containing points 1 and 2. In Gamma, calculate the polygon-buffered adjacencies using a buffer of 0, and inspect the proximity matrix. Are all of the adjacencies 0? How are points within the interior of a polygon treated when calculating this kind of adjacency?
(e) Exercise 3-5: Common border adjacency
Summary: Calculate adjacency among locations based on containment within polygons that have common borders.
Protocol: This example uses census geography for Long Island in the bna file G36059.bna.
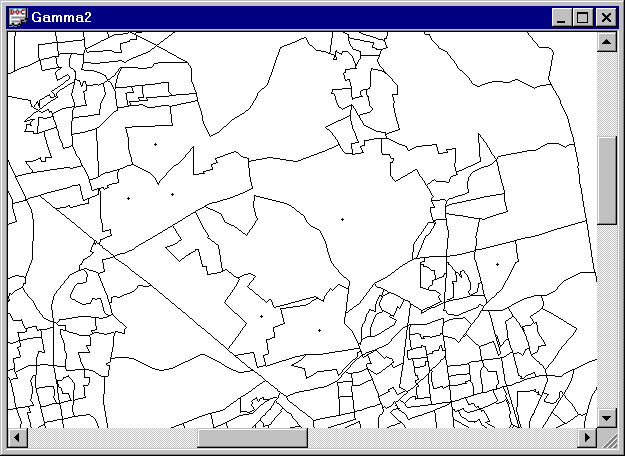 Figure 3-12. Census tracts (G36059.bna) and sampling points (Long_Island.pnt) in Long Island. Points in the same and also in adjoining census tracts are assigned an adjacency of 1. |
|
0.0 1.0 1.0 0.0 0.0 1.0 0.0 1.0 0.0 1.0 0.0 0.0 1.0 0.0 1.0 1.0 0.0 0.0 0.0 1.0 0.0 0.0 0.0 0.0 0.0 1.0 0.0 0.0 0.0 0.0 0.0 1.0 0.0 1.0 0.0 1.0 1.0 1.0 0.0 1.0 0.0 0.0 0.0 0.0 0.0 0.0 0.0 0.0 0.0 |
Problem: Relate the values in the proximity matrix to the map of the census boundaries and sample points in Figure 3-12. Can you identify all of the sampling points by examination of the map and proximity matrix? Why or why not?
(f) Exercise 3-6: Distance, point-point
Summary: Calculate the geographic (Euclidean) distances among the points in the file Chapter_3.pnt.
Protocol:
| 0.000 | 2.736 | 35.162 | 34.896 | 34.853 |
| 2.736 | 0.000 | 32.448 | 32.215 | 32.176 |
| 35.162 | 32.448 | 0.000 | 11.044 | 11.349 |
| 34.896 | 32.215 | 11.044 | 0.000 | 0.316 |
| 34.853 | 32.176 | 11.349 | 0.316 | 0.000 |
The bold element is g21 and is the geographic distance between points 2 and 1.
Problem: Distribution theory often is based on assumptions such as independent observations. Are the upper right off diagonal elements (underlined) of this distance matrix independent? Why or why not? Calculate the row sums of this matrix (e.g. the first row sum is 107.647). What do these sums mean in terms of the spatial relationships among the sample locations?
(g) Exercise 3-7: Point-line distances
Summary: Calculate distances between points as the sum of the distances from each point to the nearest line. This example uses Chapter_3.pnt and Ch3_line.bna.
Protocol:
The elements of the proximity matrix are the sum of the distances from each point to the line feature. For example, the underlined elements are the sum of the distance from point 3 to the line plus the distance from point 4 to the line. For this proximity metric points 1 and 4 are nearer to one another than points 3 and 4.
Problem: Describe a situation where proximity measured as point-line distances are a better proximity metric than point-point distances.
(h) Exercise 3-8: Point-polygon distances
Summary: Calculate distances between points as the sum of the distances from each point to the polygon. This example uses Chapter_3.pnt and Ch3_poly.bna. The map of the points and polygon are shown in Figure 3-11.
Protocol:
| 0.000 | 59.662 | 39.330 | 34.525 | 34.681 |
| 59.662 | 0.0000 | 36.610 | 31.805 | 31.961 |
| 39.330 | 36.610 | 0.000 | 11.473 | 11.629 |
| 34.525 | 31.805 | 11.473 | 0.000 | 6.824 |
| 34.681 | 31.961 | 11.629 | 6.824 | 0.000 |
The ijth element of the proximity matrix is the sum of the distances from the ith and jth distances to the polygon. For example, the underlined elements are the sum of the distance from point 1 to the polygon plus the distance from point 2 to the polygon.
Problem: Describe a situation where proximity measured as point-polygon distances are a better proximity metric than point-point distances.