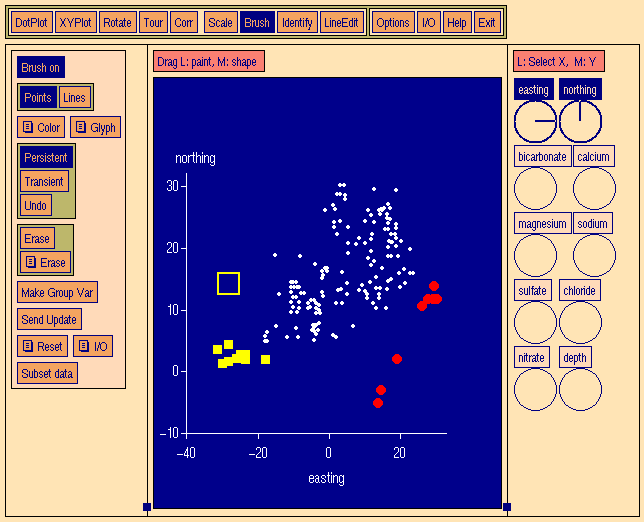
In the following slide, we select two areas of the study region which are distinctly different: the south east and south west. We use distinct color/glyph (symbol) type combinations for each one.
(The square yellow frame is the paint brush, which was used to turn the points yellow with the square glyph.)
Now we switch to rotation mode, and change to a three-dimensional view of the data in variable space (bicarbonate, nitrate, calcium). As we rotate in variable space, you can see that the two regions are "linearly separable": that is, we could pass a plane between them to separate them:
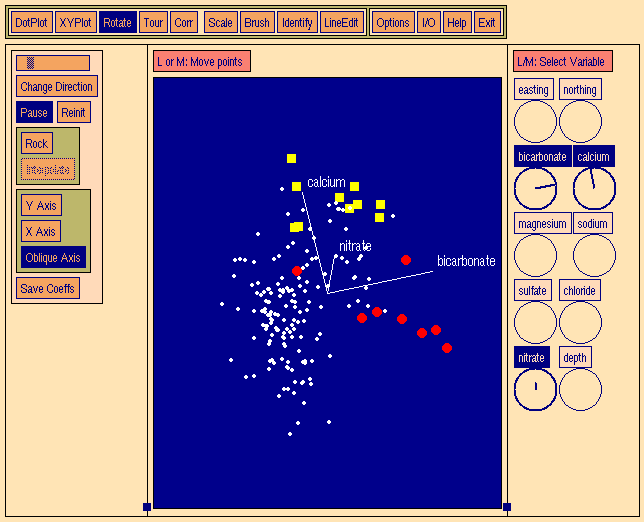
In this case, clustering in 2-d physical space (easting, northing) is intimately tied to clustering in the 3-d variable space of calcium, nitrate, and bicarbonate.
The software for this series of slides is called XGobi. It is very powerful and useful for exploratory analysis. Unfortunately, it is primarily UNIX software (and we are focusing mostly on Windows tools). It is featured in one of our labs (try it sometime if you're UNIX-able).