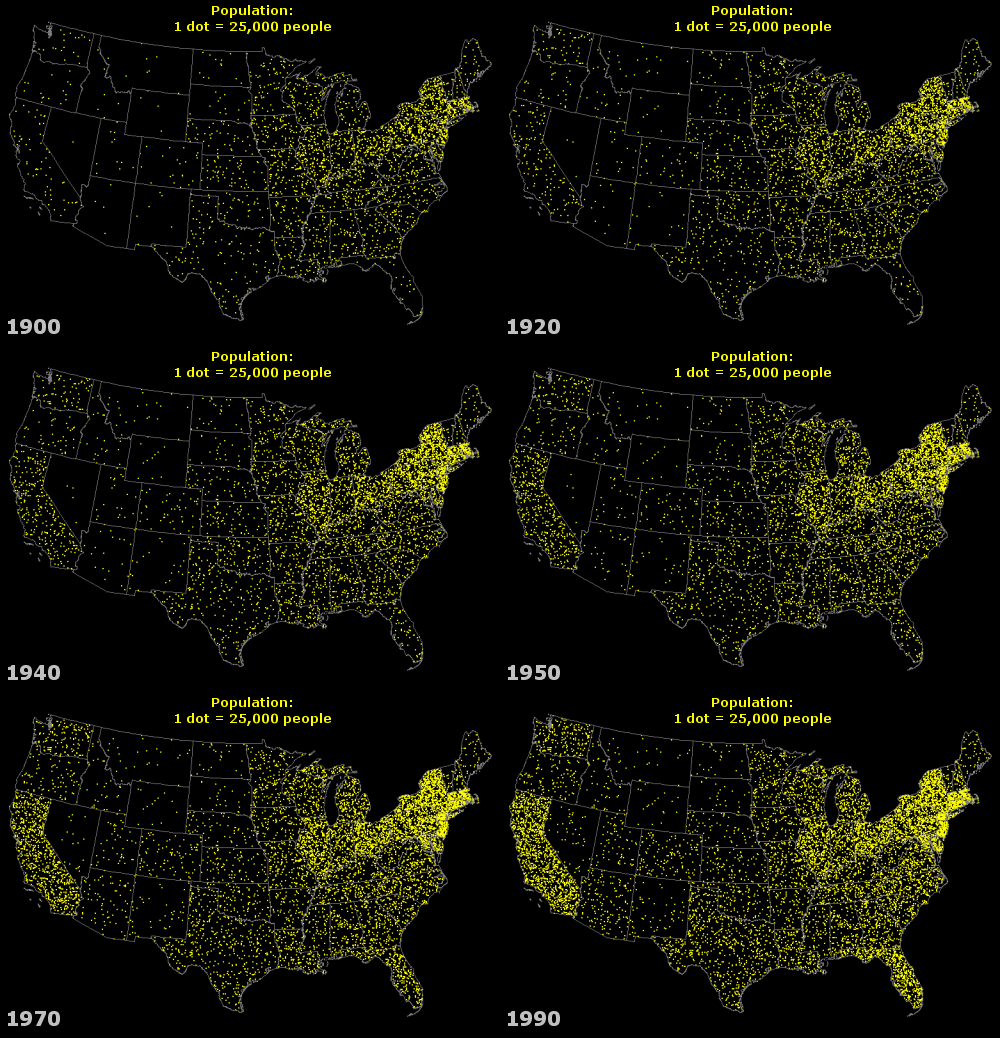
| Title | US Population Change by Decade (Animated) |
| Author | Steve Wallace |
| Products | MapInfo Professional |
| Date | 10/27/99 |
| Description |
Here is a map done with MapInfo to show population change by state by decade. The individual maps were done in MapInfo as dot density thematics, with the windows saved as Bitmaps. These were rescaled in Paint Shop Pro v6, and put together as a 78k
animated GIF
with Animation Shop 2 (included with PSPv6).
|

|
|