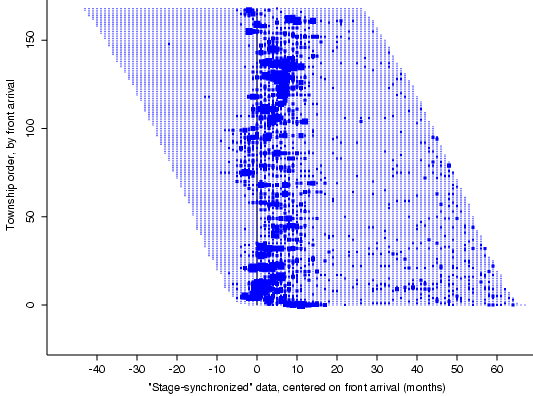
The 169 time-series have been shifted to the
location of the front (at time 0), as given by the model in
the previous slide.
"Township order" is from southwest to northeast. Again, size of dot
indicates number of cases reported by a town.
The towns in the southwest, which were the first to report, thus appear at
the bottom in this plot: the front hits them early in their time series, and
they spend proportionally more of their time in the "post front" stage, and
inform us the most about the endemic phase (the right tails).