Today:
- Return Exam 3
- Mean: 70
- StdDev: 20
- Curve: add 2.5 points to your total
- You can get 20% of your lost points by meeting with me to go over
your exam. For example, if you got a 60, you can get
.2*(100-60)=8 points by meeting to go over the exam.
- I need the tests back to do some more analysis -- you'll get them
back for good on Thursday.
- Quiz next time over the Chi-square distribution (today's topic)
- Nice example of
2-way ANOVA (basically, the idea is that we introduce additional factors as
independent variables)
- Section 12.1: Comparing two qualitative variables: the chi-square test
- How could we determine if men, women, and children have the same
opinion of four breakfast cereals? We might do a survey,
collect data, and then make a statistical answer. What would
lead us to say that they have the same opinion?
- One approach:
Data is summarized in a contingency table, with one
variables' levels across the top (e.g. men, women,
children) and with the other variables' levels across the side
(e.g. Cereal A, Cereal B, Cereal C, Cereal D). The cells
might contain the counts of those who pick that cereal
as the best (ties not permitted).
|
Men |
Women |
Children |
| Cereal A |
9 |
12 |
15 |
| Cereal B |
25 |
30 |
19 |
| Cereal C |
35 |
25 |
20 |
| Cereal D |
31 |
33 |
46 |
- We might also include row and column totals in the
table. There will be some dependency in the counts.
|
Men |
Women |
Children |
Total |
| Cereal A |
9 |
12 |
15 |
36 |
| Cereal B |
25 |
30 |
19 |
74 |
| Cereal C |
35 |
25 |
20 |
80 |
| Cereal D |
31 |
33 |
46 |
110 |
Total6.4 |
100 |
100 |
100 |
300 |
- Chi-square test: A test for dependence of two variables (p. 495)
Decision rule: Accept Ha if p-value <
Test Statistic:
- Conditions of using a chi-square test (p. 496):
- The sampled data must be obtained by
- Selecting a random sample of the population of
interest, or
- Selecting random and independent samples for each
level of one of the variables.
- All expected cell counts must be greater than or equal to
5.
- The chi-square distribution
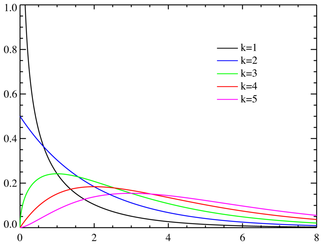
- Is skewed right:

- Calculation requires knowing degrees of freedom
("k" in the plot above; df=(R-1)(C-1), where
R is the number of
levels of one variable and C is the number of
levels of the other)
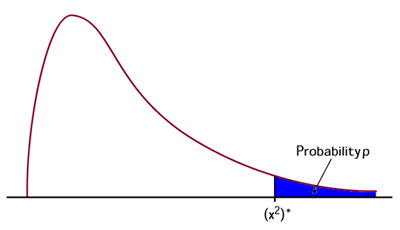
- Large values of chi-square signify that it's unlikely that
the the variables are independent (reject the
null!). As you can see, p-values are in the right tail area:

- To get an idea of what is "large", the mean of the
chi-square is df, and the standard deviation is the
square root of 2*df.
- Examples:
- Section 12.2: Describing the relationship: sample percentages
- The web example above leads us into section 12.2. Once the
chi-square test indicates that there is dependence in the variables, we want to
have an easy way to describe it, and sample percentages is the easiest way.
- Note: we do not perform the chi-square test on the
percentages, but rather on the actual data collected instead. If we do not
detect a dependency, then we do not move to the discussion of the differences
in percentages.
- Let's return to Exercise 1, page 503/509:
http://www.nku.edu/~statistics/data/c12s01e01.xls
Links
Website maintained by Andy Long.
Comments appreciated.

